Spectraware S1000 Spectrum Analysis Software

* S1000 works only with the thinkRF RTSA
Comprehensive data visualization and measurement tools for both spectrum and signal analysis*.
*S1000 works only with the thinkRF RTSA. *It’s Linux compatible as well.
Extract the Original Information Bearing Signal From a Carrier Wave For a Deeper Signal Analysis
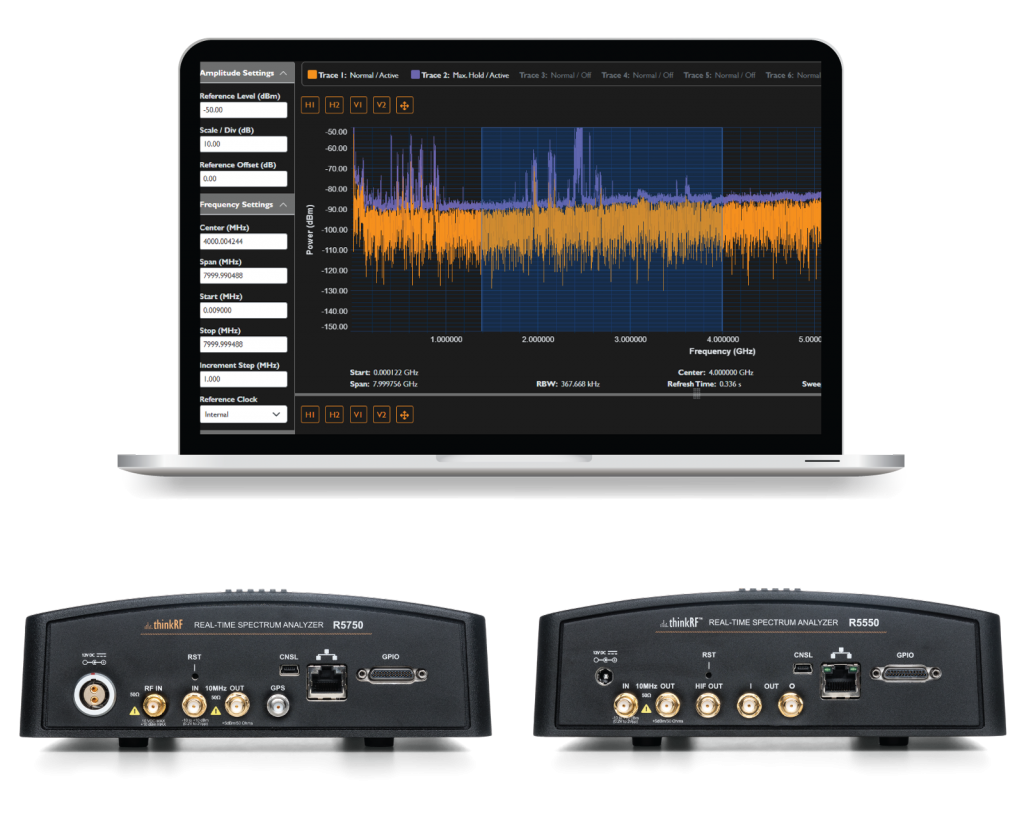
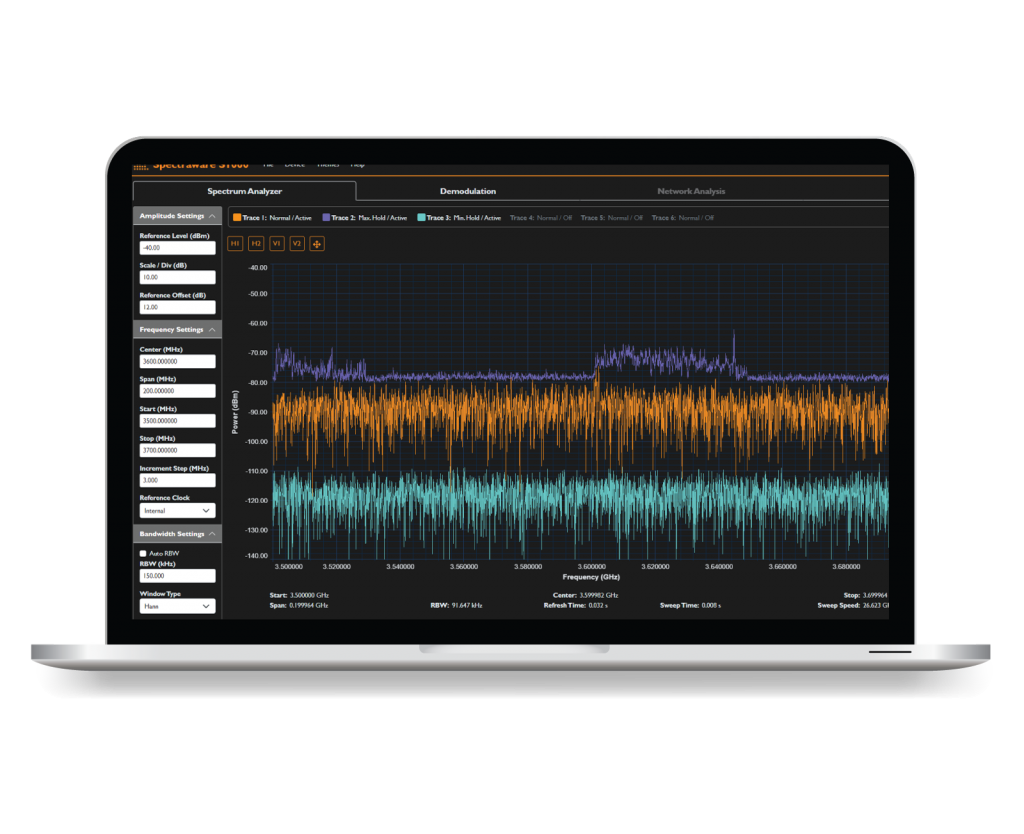
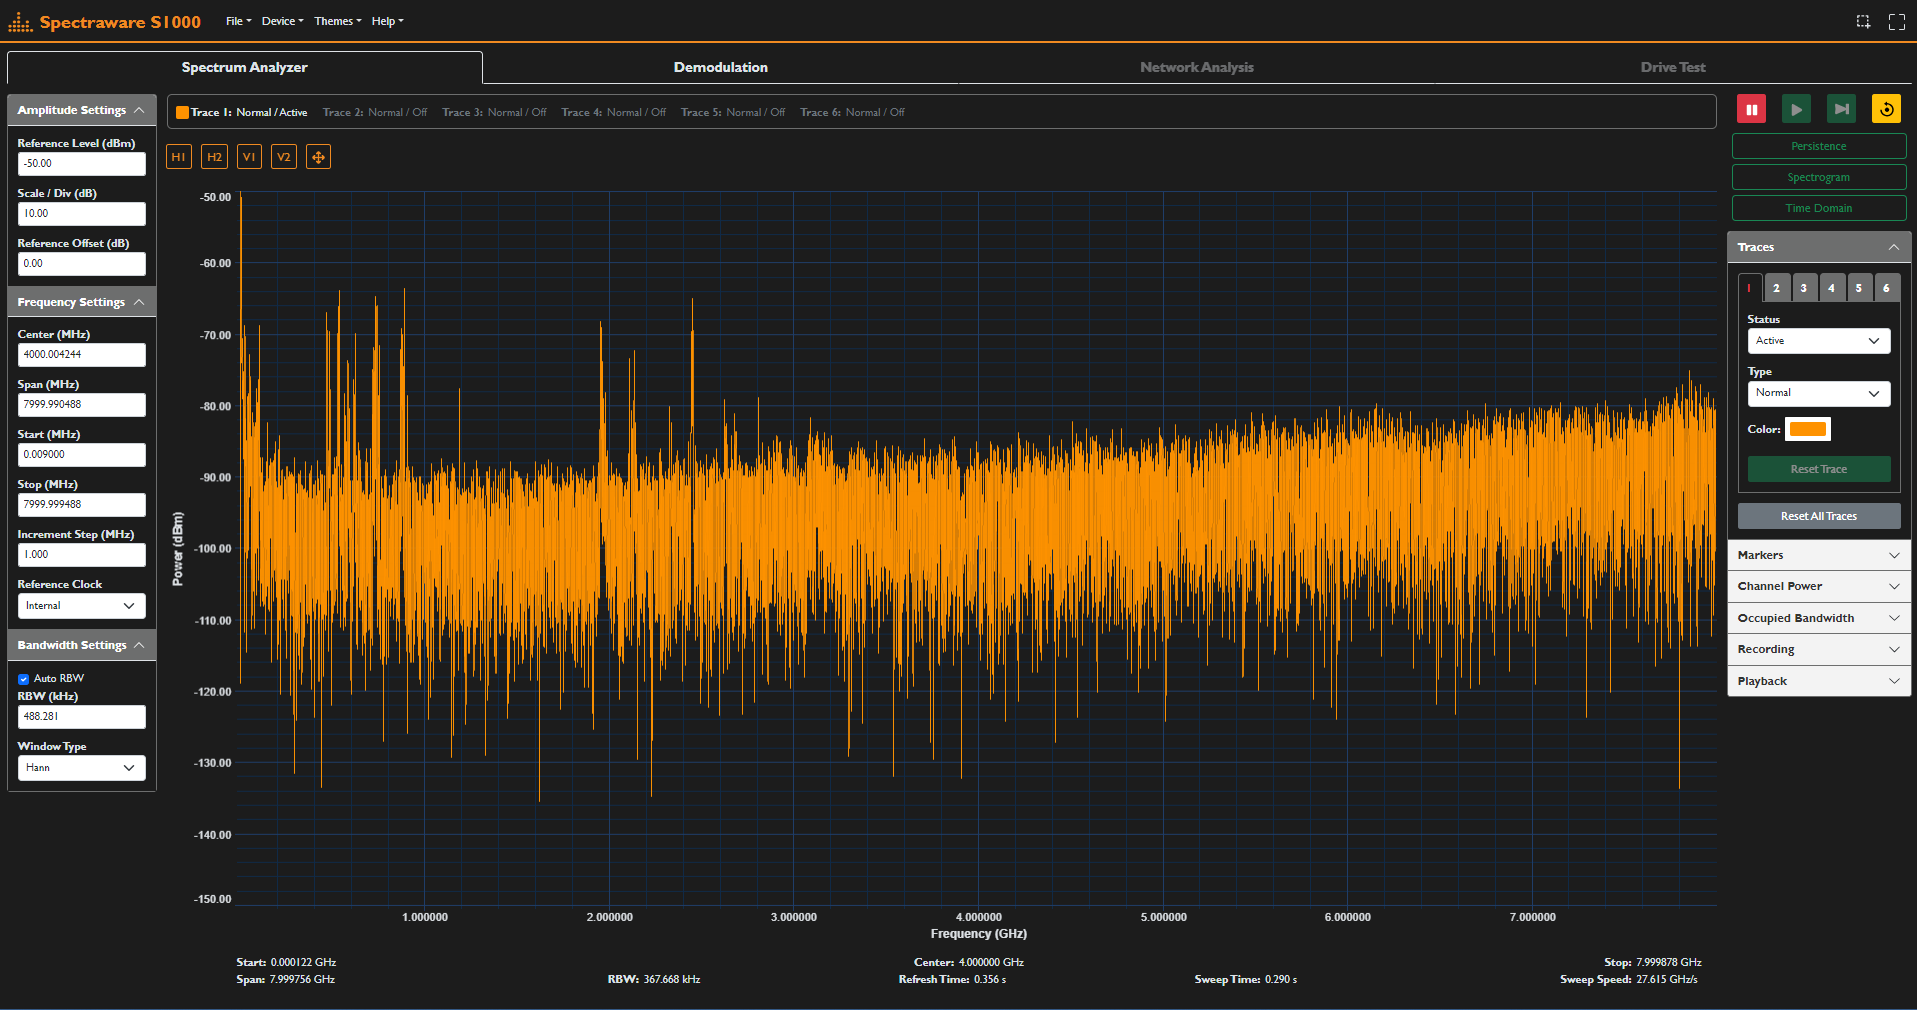
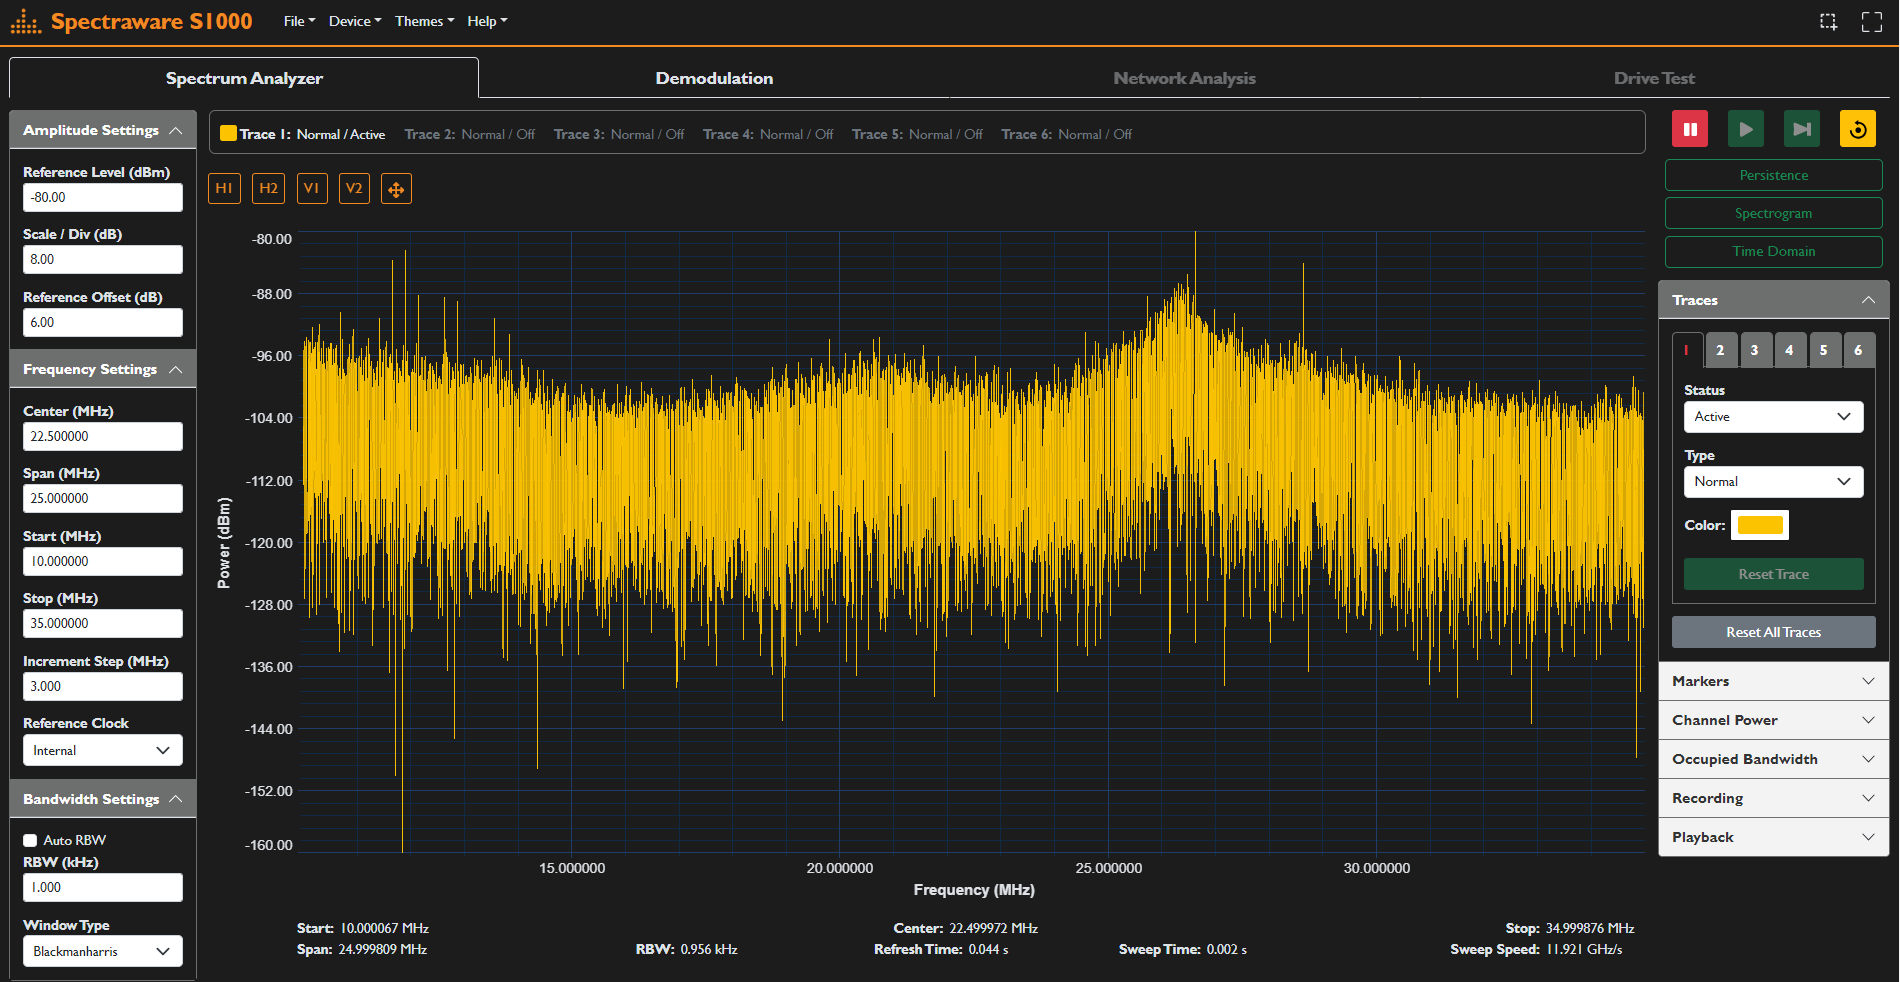
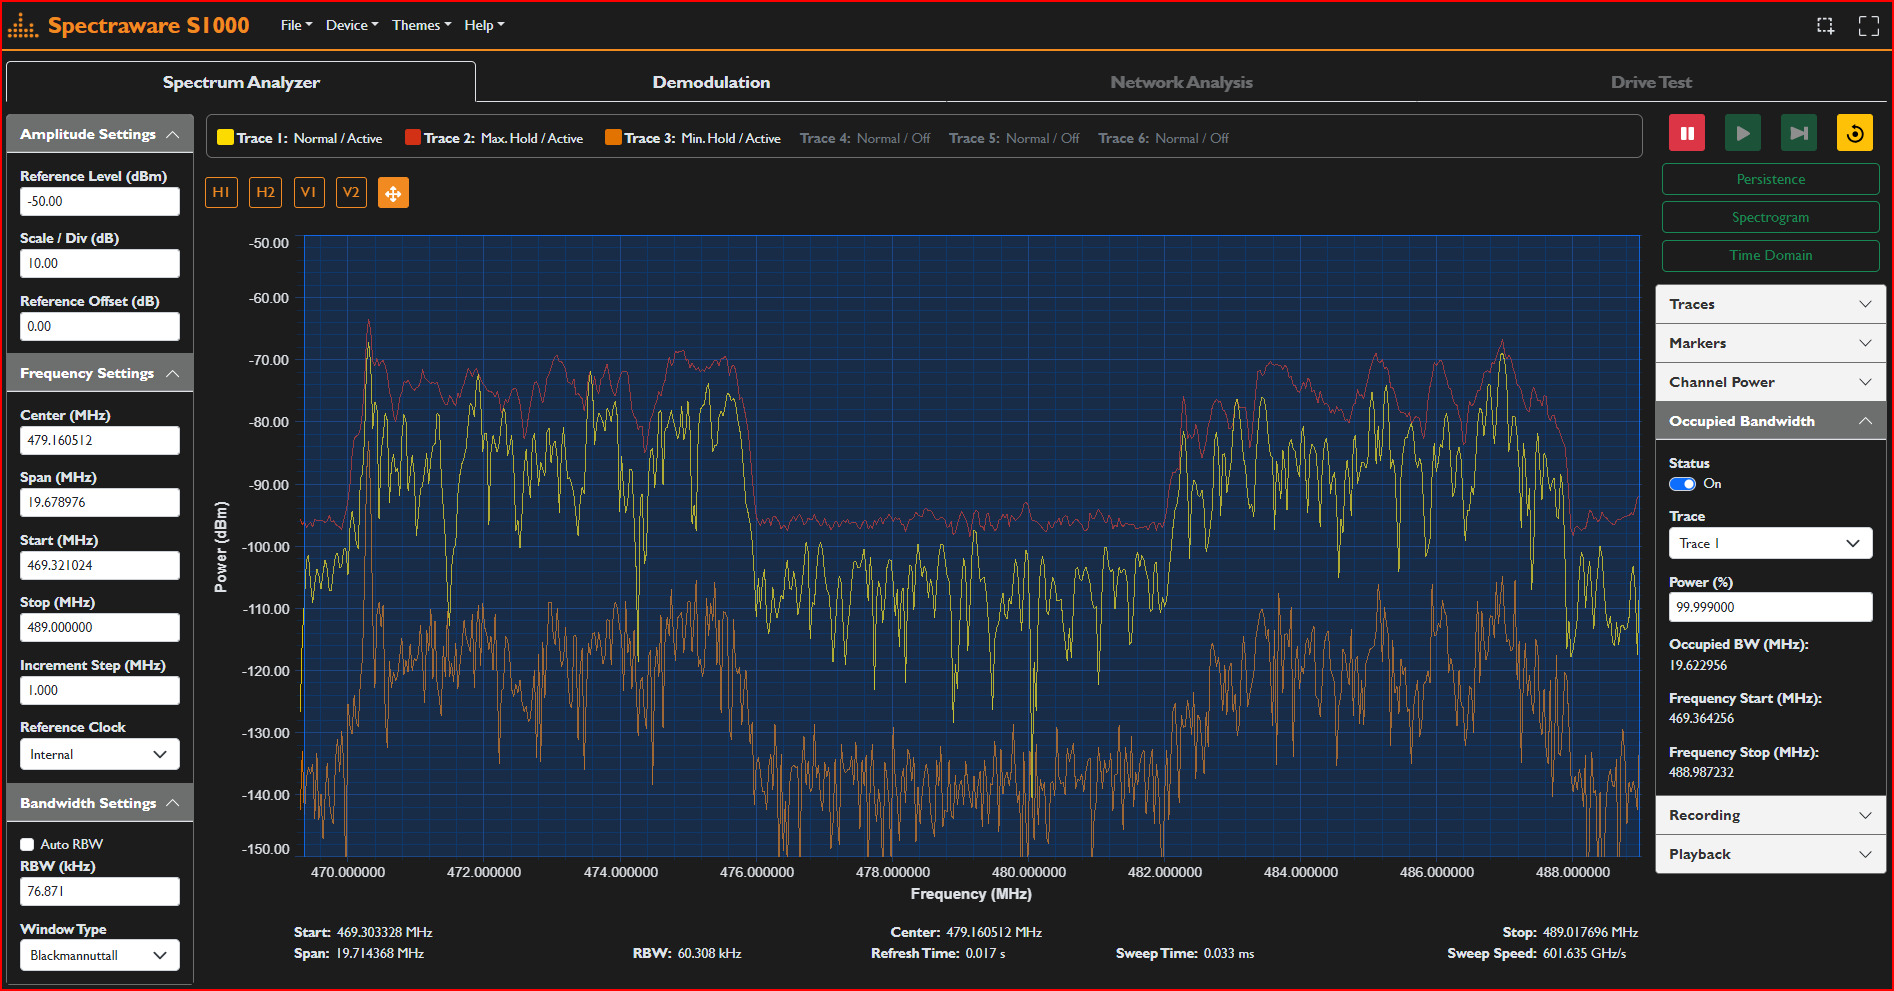
The thinkRF Spectrum Analysis Software features an advanced graphical user interface (GUI) that has been designed with the end-user in mind. Common functions, including Frequency, Bandwidth, and Amplitude are always visible, while all other settings are accessible with a minimum number of clicks to keep the view of the spectrum front and center. Customized settings can be saved and reloaded to simplify the setup of common applications and uses.
Coupled with leading the thinkRF Real-Time Spectrum Analyzers, users gain access to the performance, capabilities, and functions needed to conduct spectrum and signal analysis for regulatory and intelligence monitoring and telecom deployment optimization. Comprehensive data visualization modes, automated measurement tools, and demodulation capabilities provide users with enhanced usability in a cost-effective and intuitive application.
Seamlessly integrate with the thinkRF Real-Time Spectrum Analyzers without any additional set up
Cost-effective spectrum and signal analysis software that doesn’t sacrifice important functions or performance
Easy to use, intuitive software presented in a clean, professional package
Linux compatible. *S1000 works only with the thinkRF RTSA.
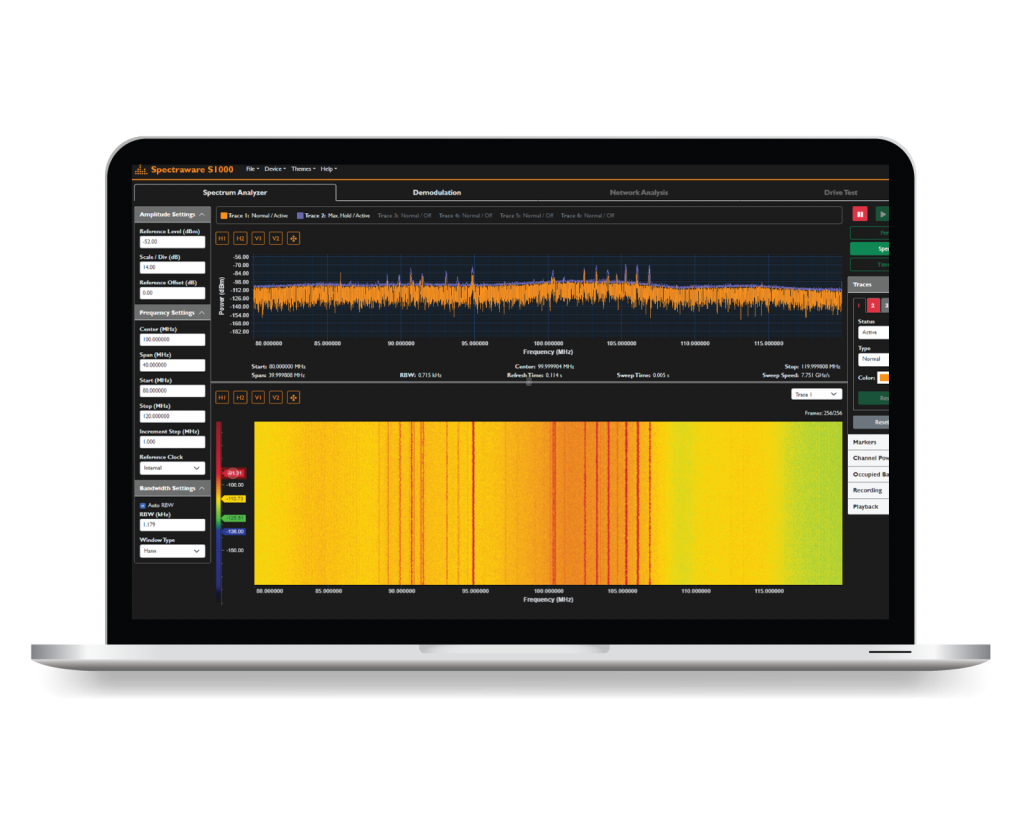
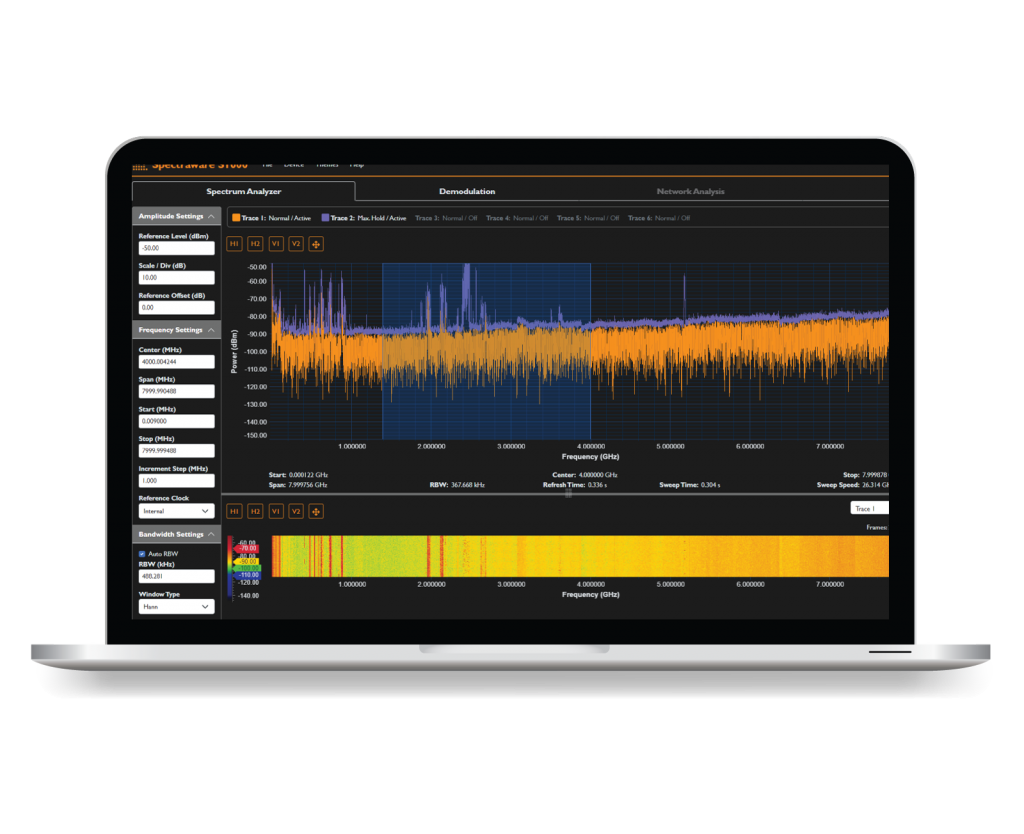
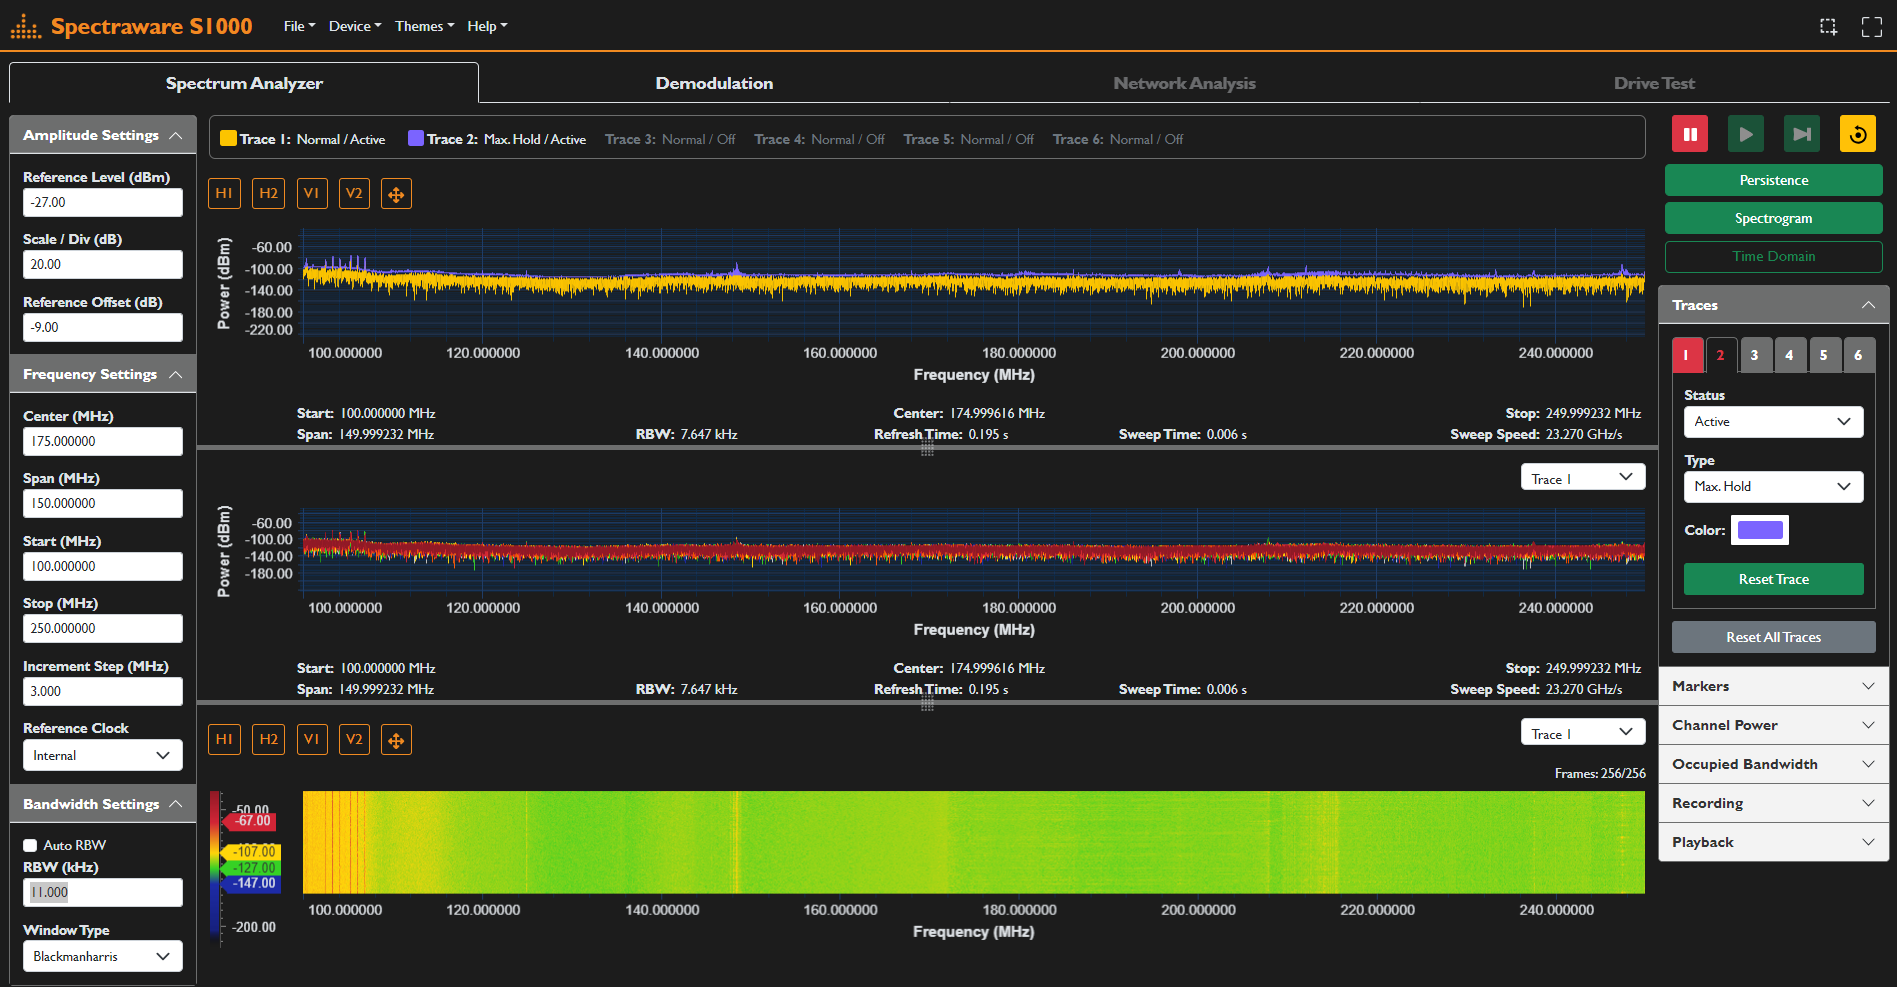
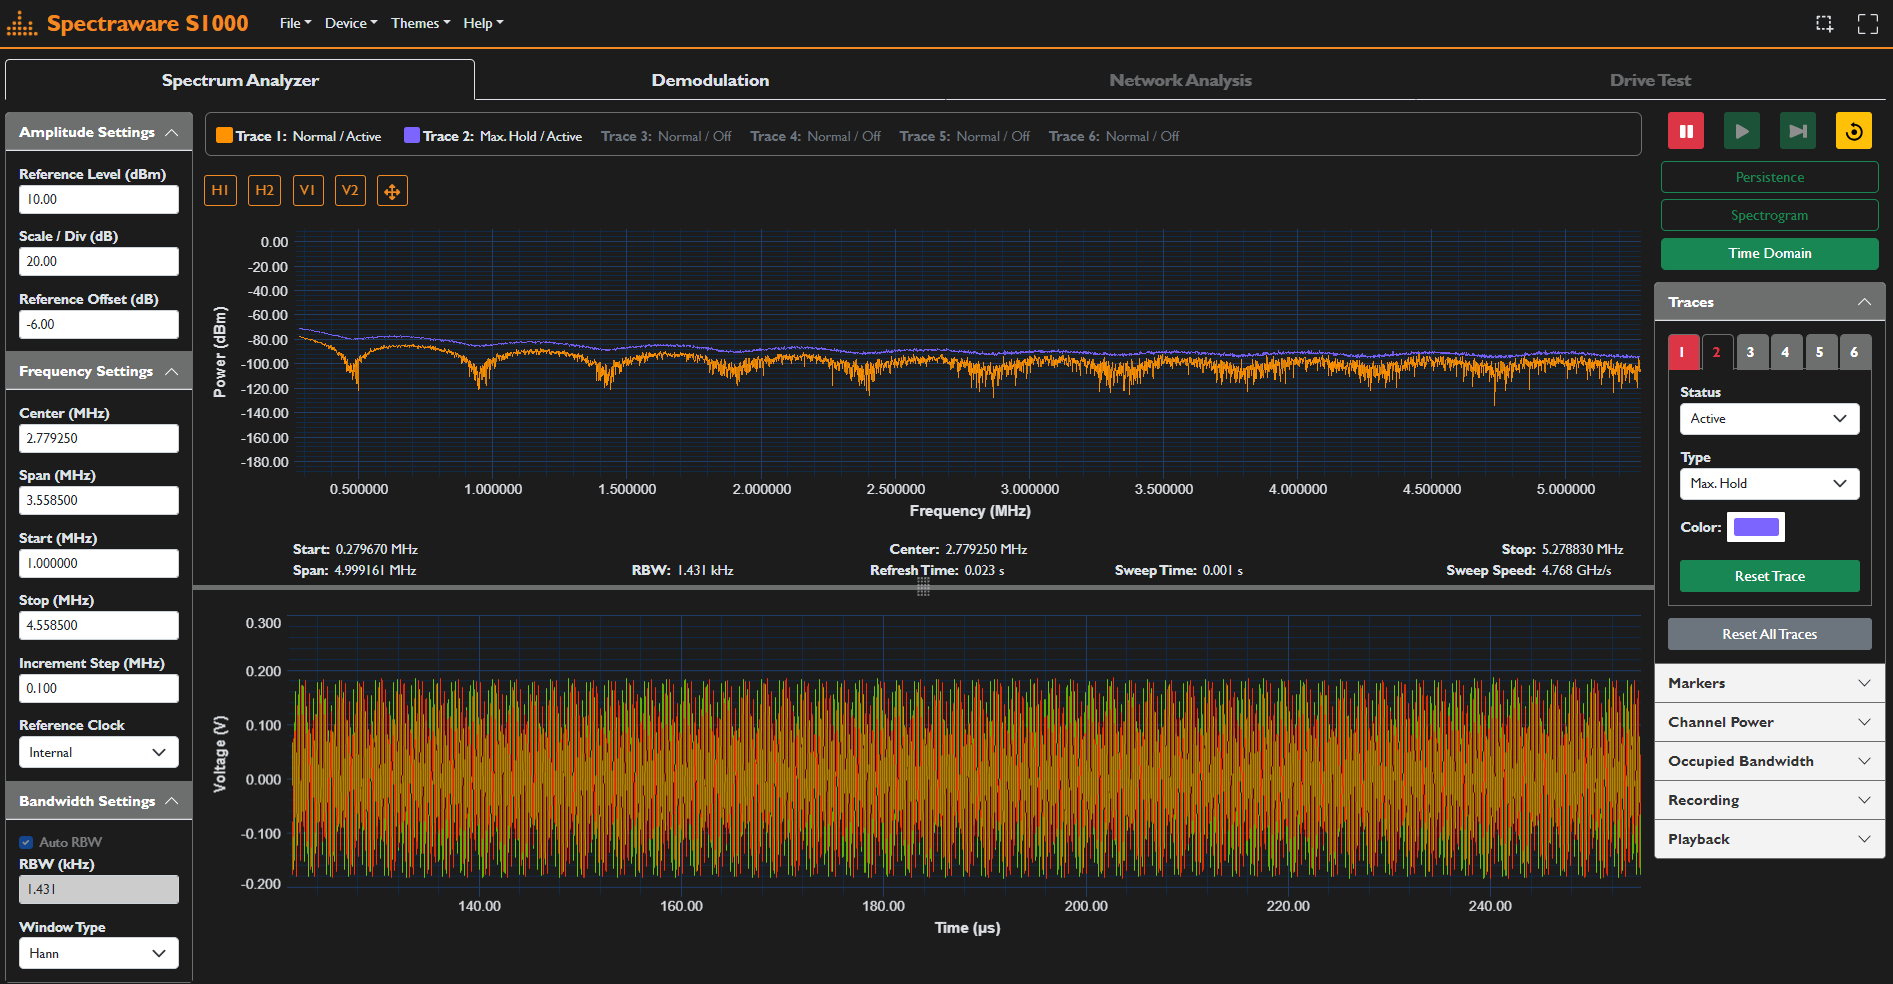
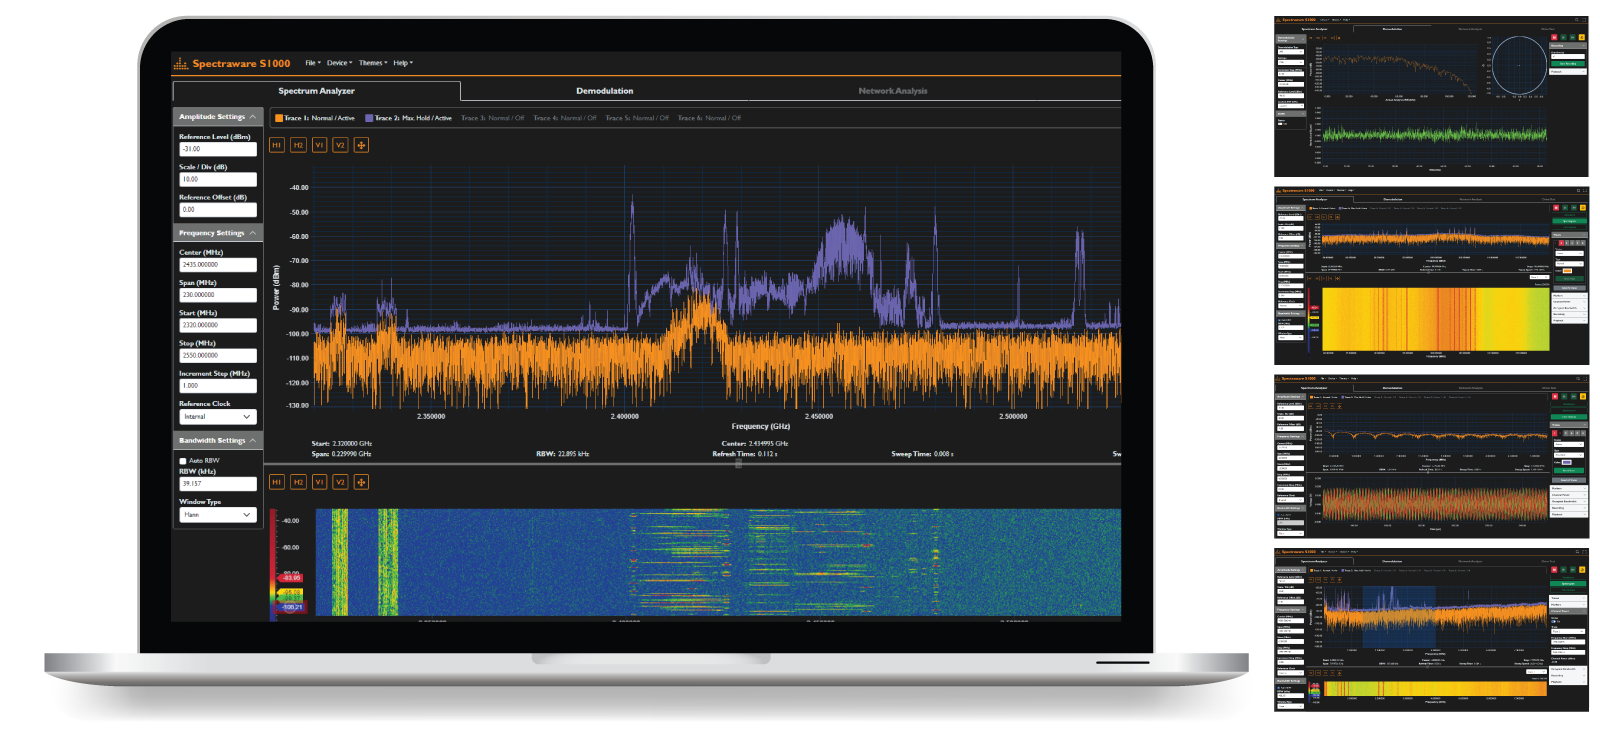
Comprehensive Data Visualization
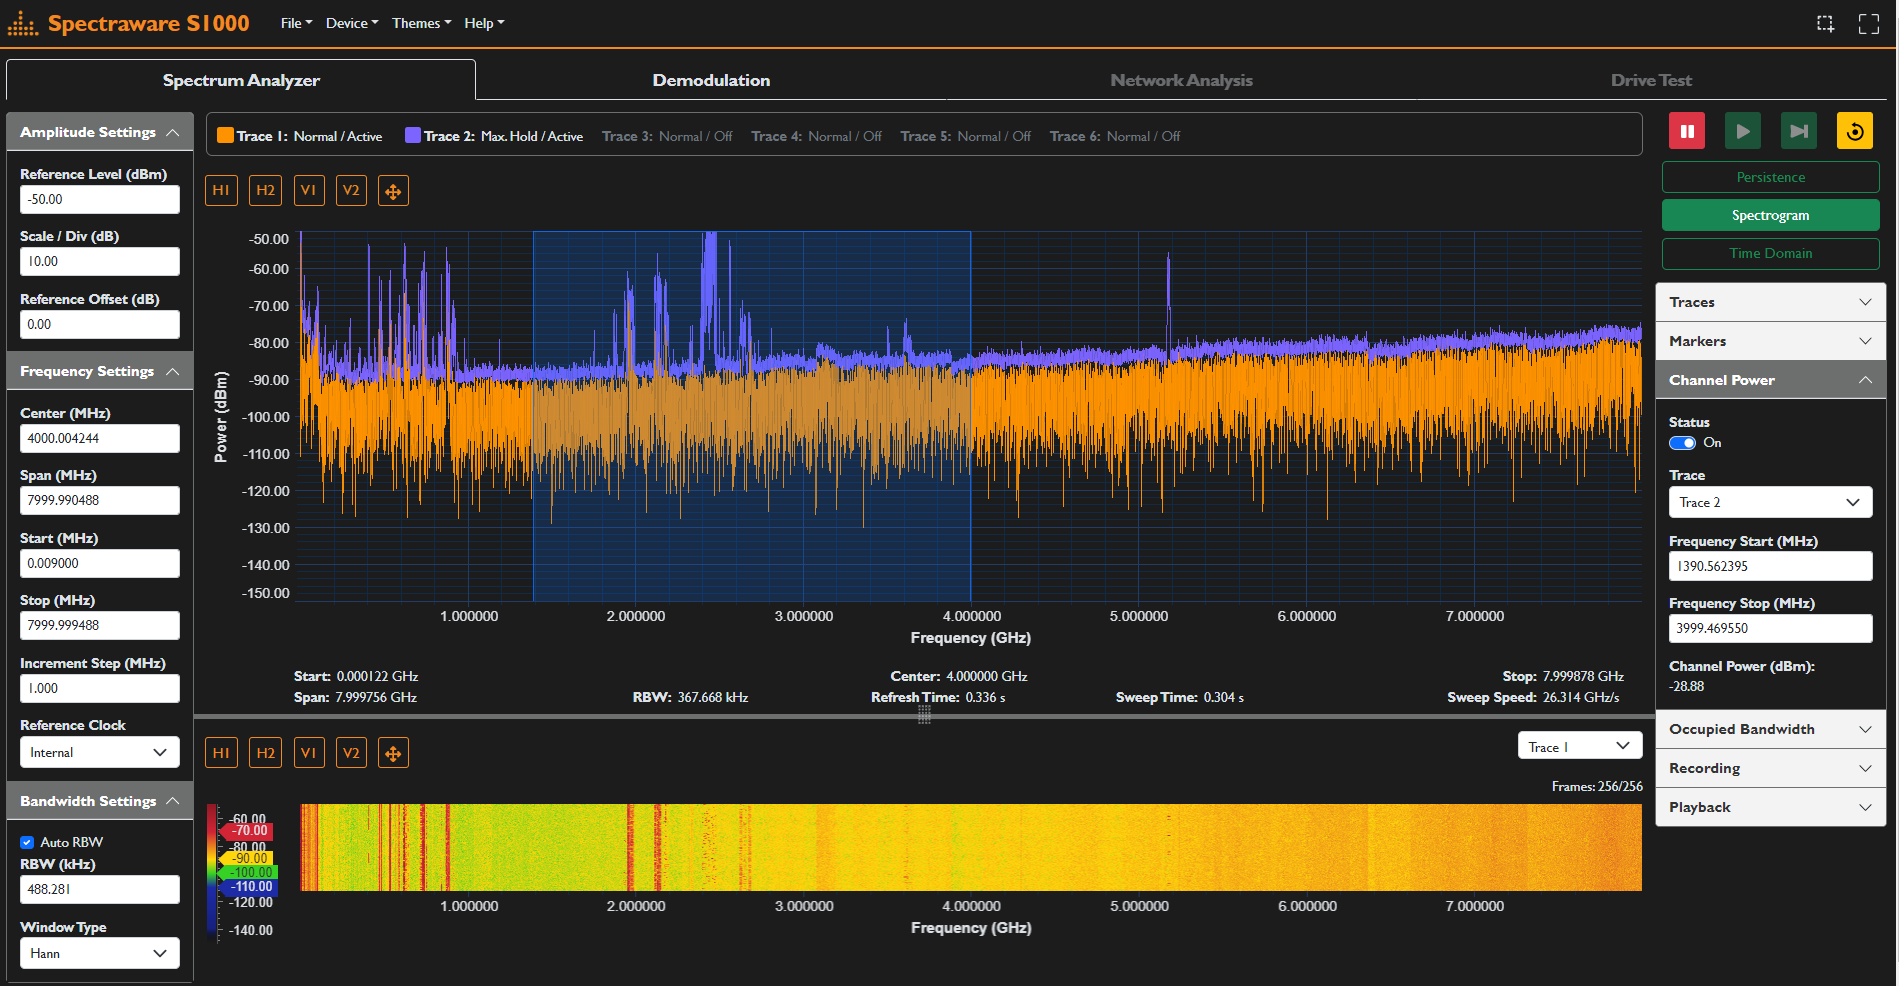
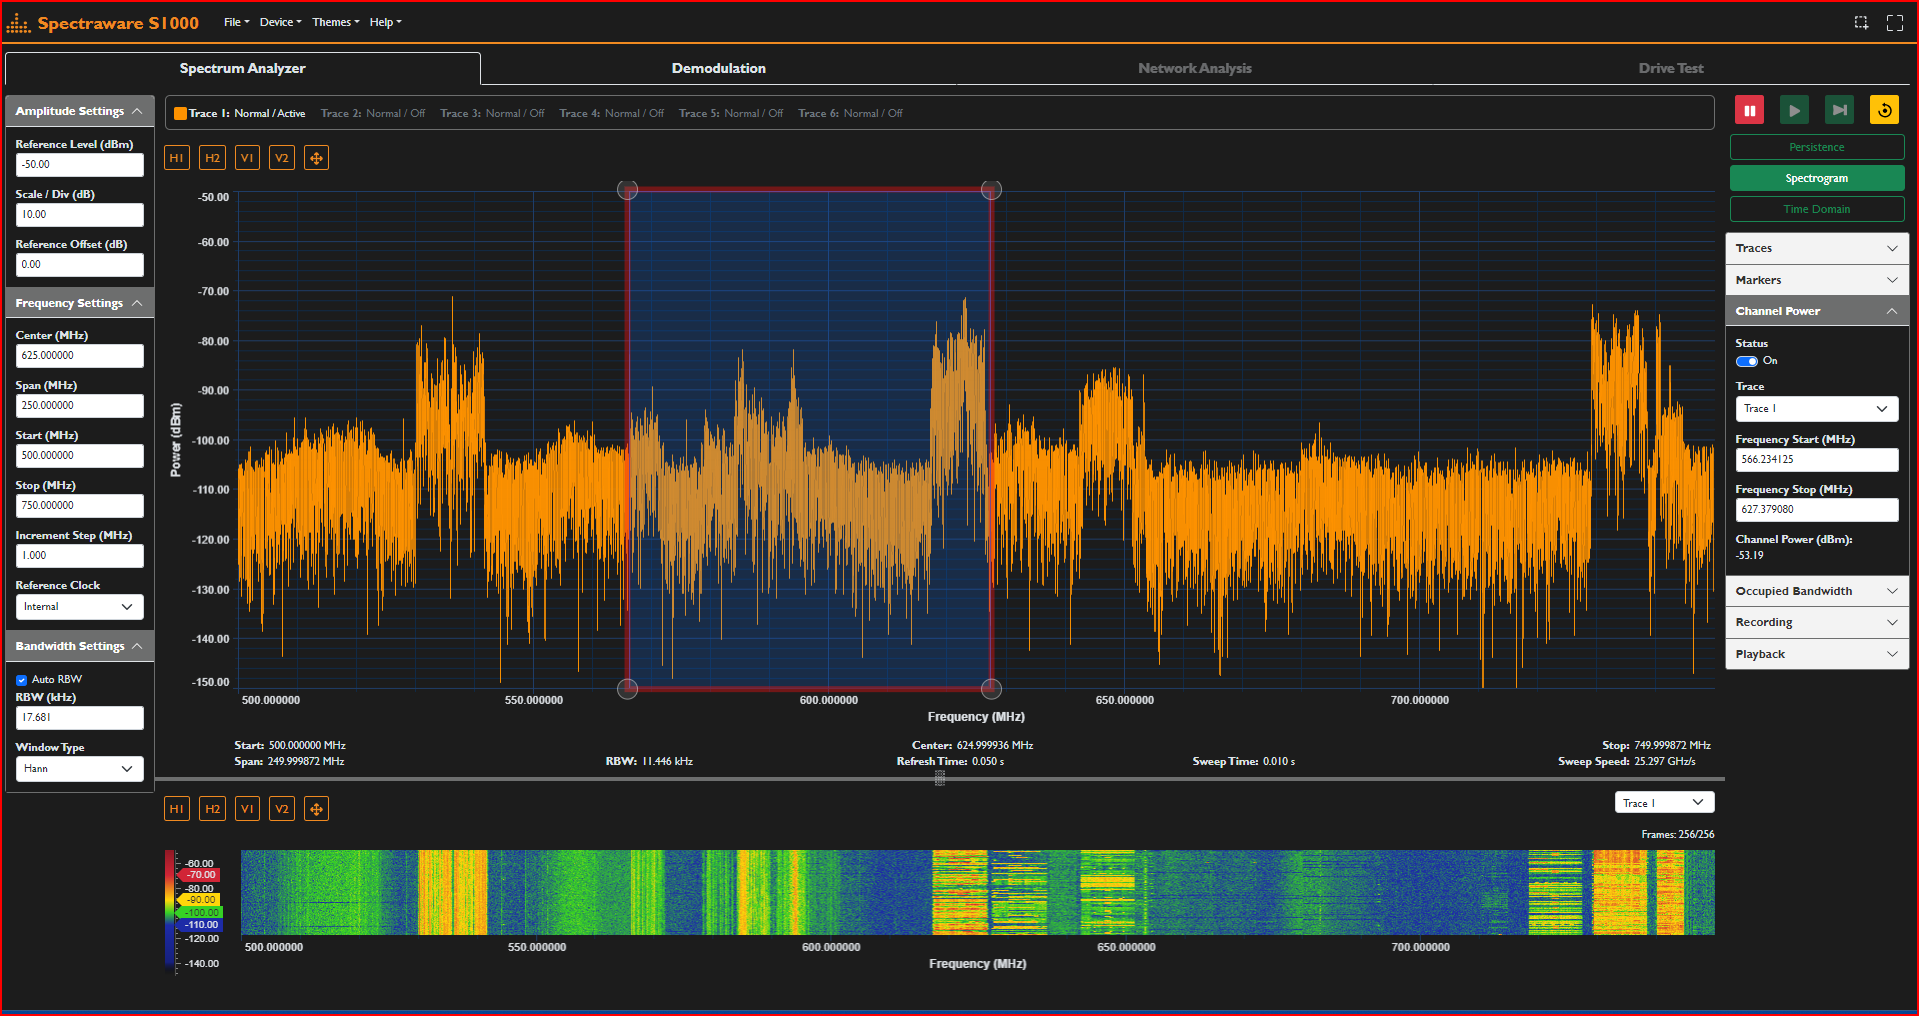
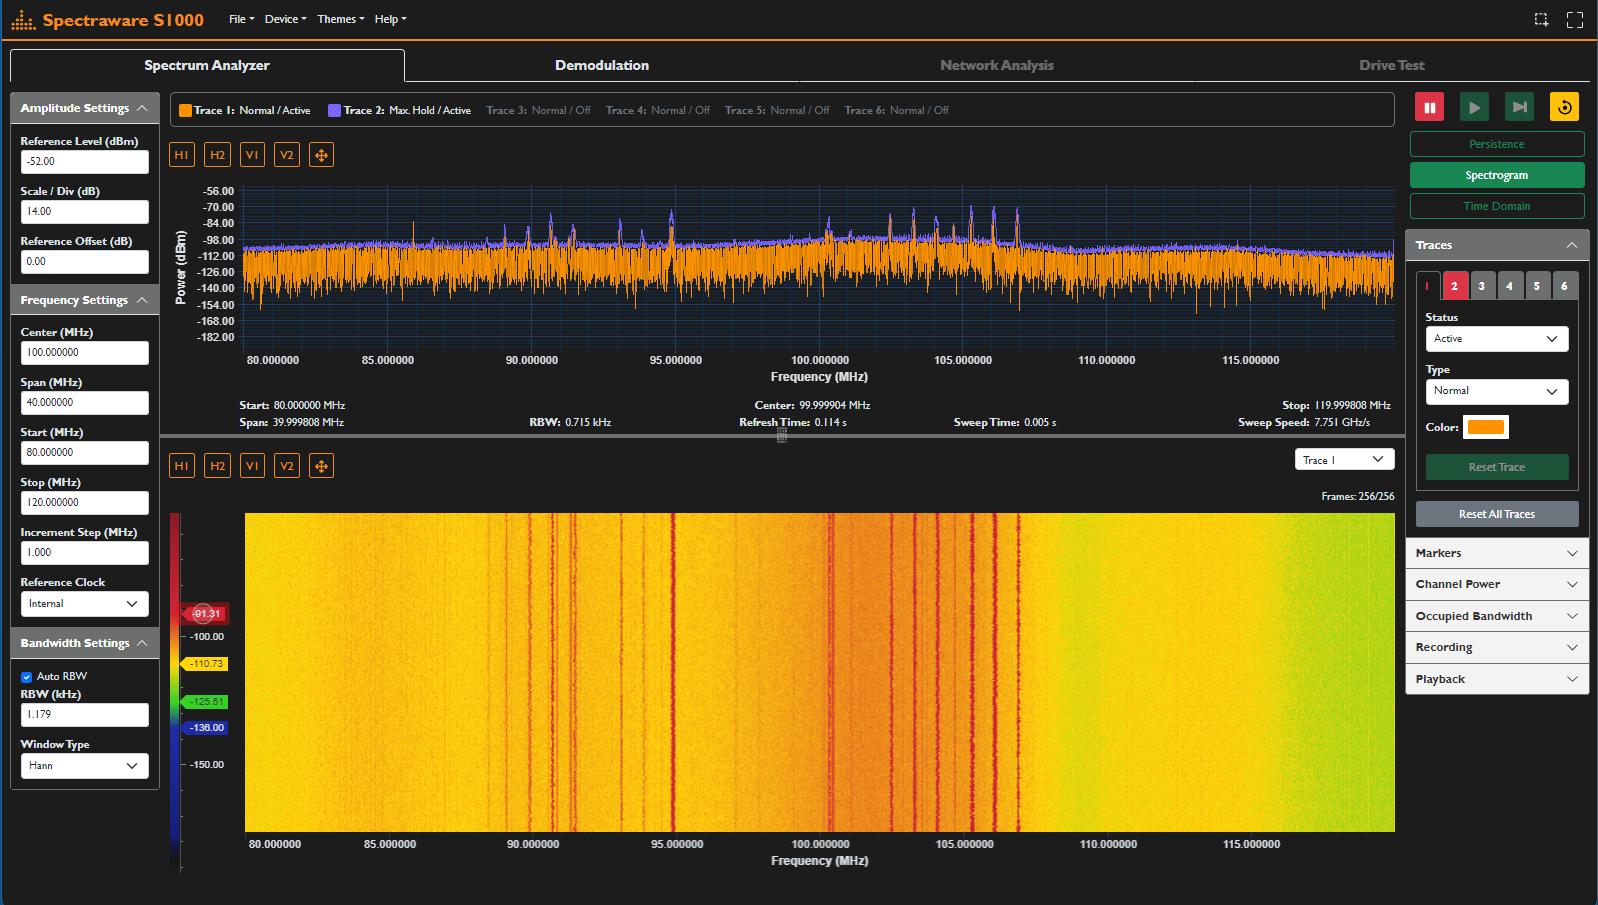
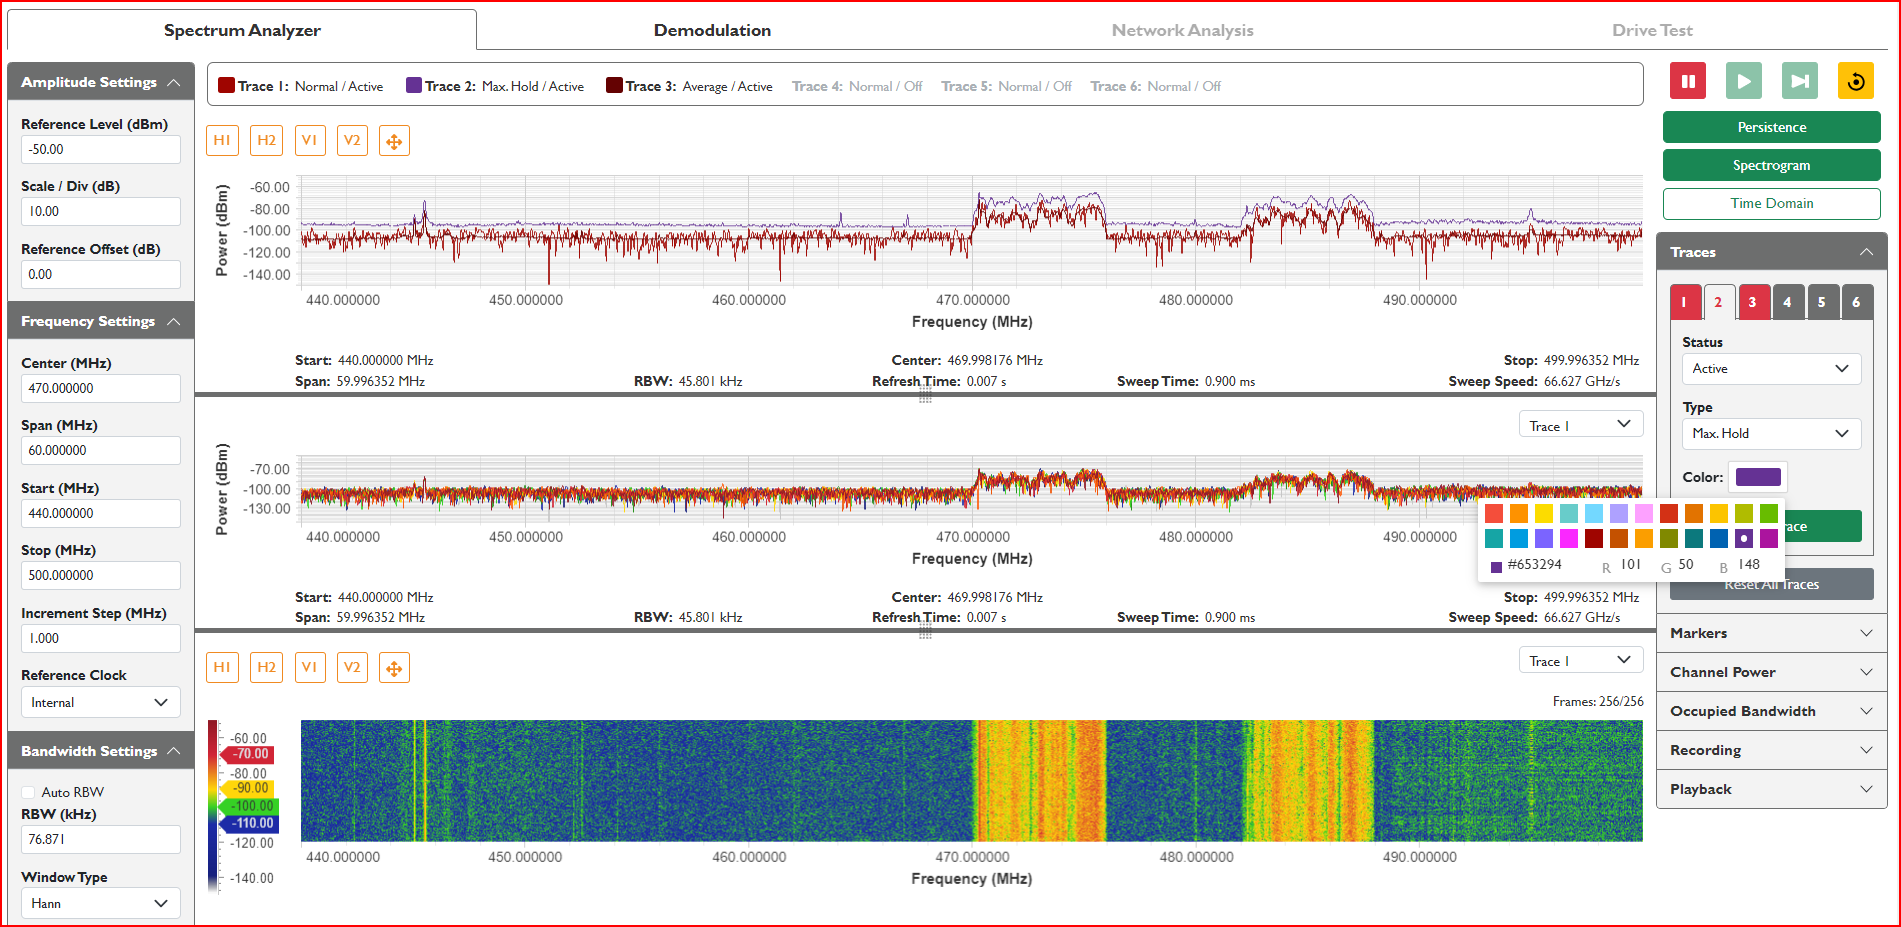
With 100 MHz, 40 MHz, 10 MHz, or 100 kHz real-time bandwidth (RTBW), the Spectraware S1000 software is powerful enough for any application. Featuring three visualization modes – Spectrogram, Persistence, and Time Domain – you can select the best view depending on your application and analysis requirements.
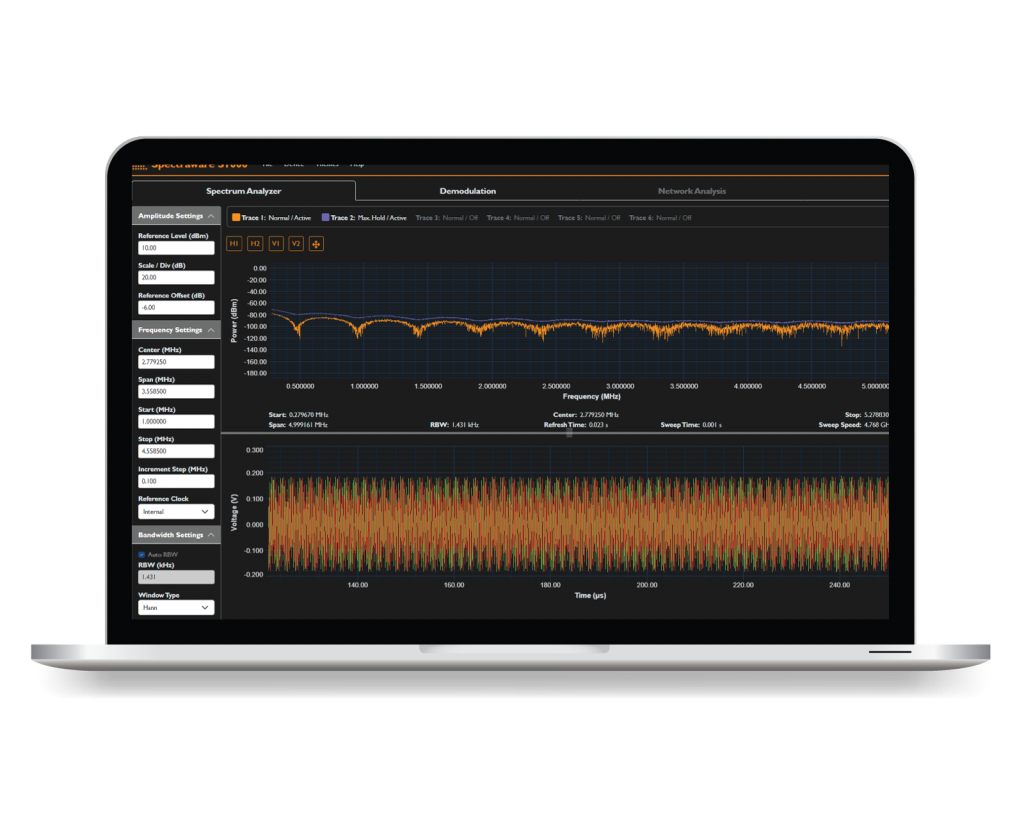
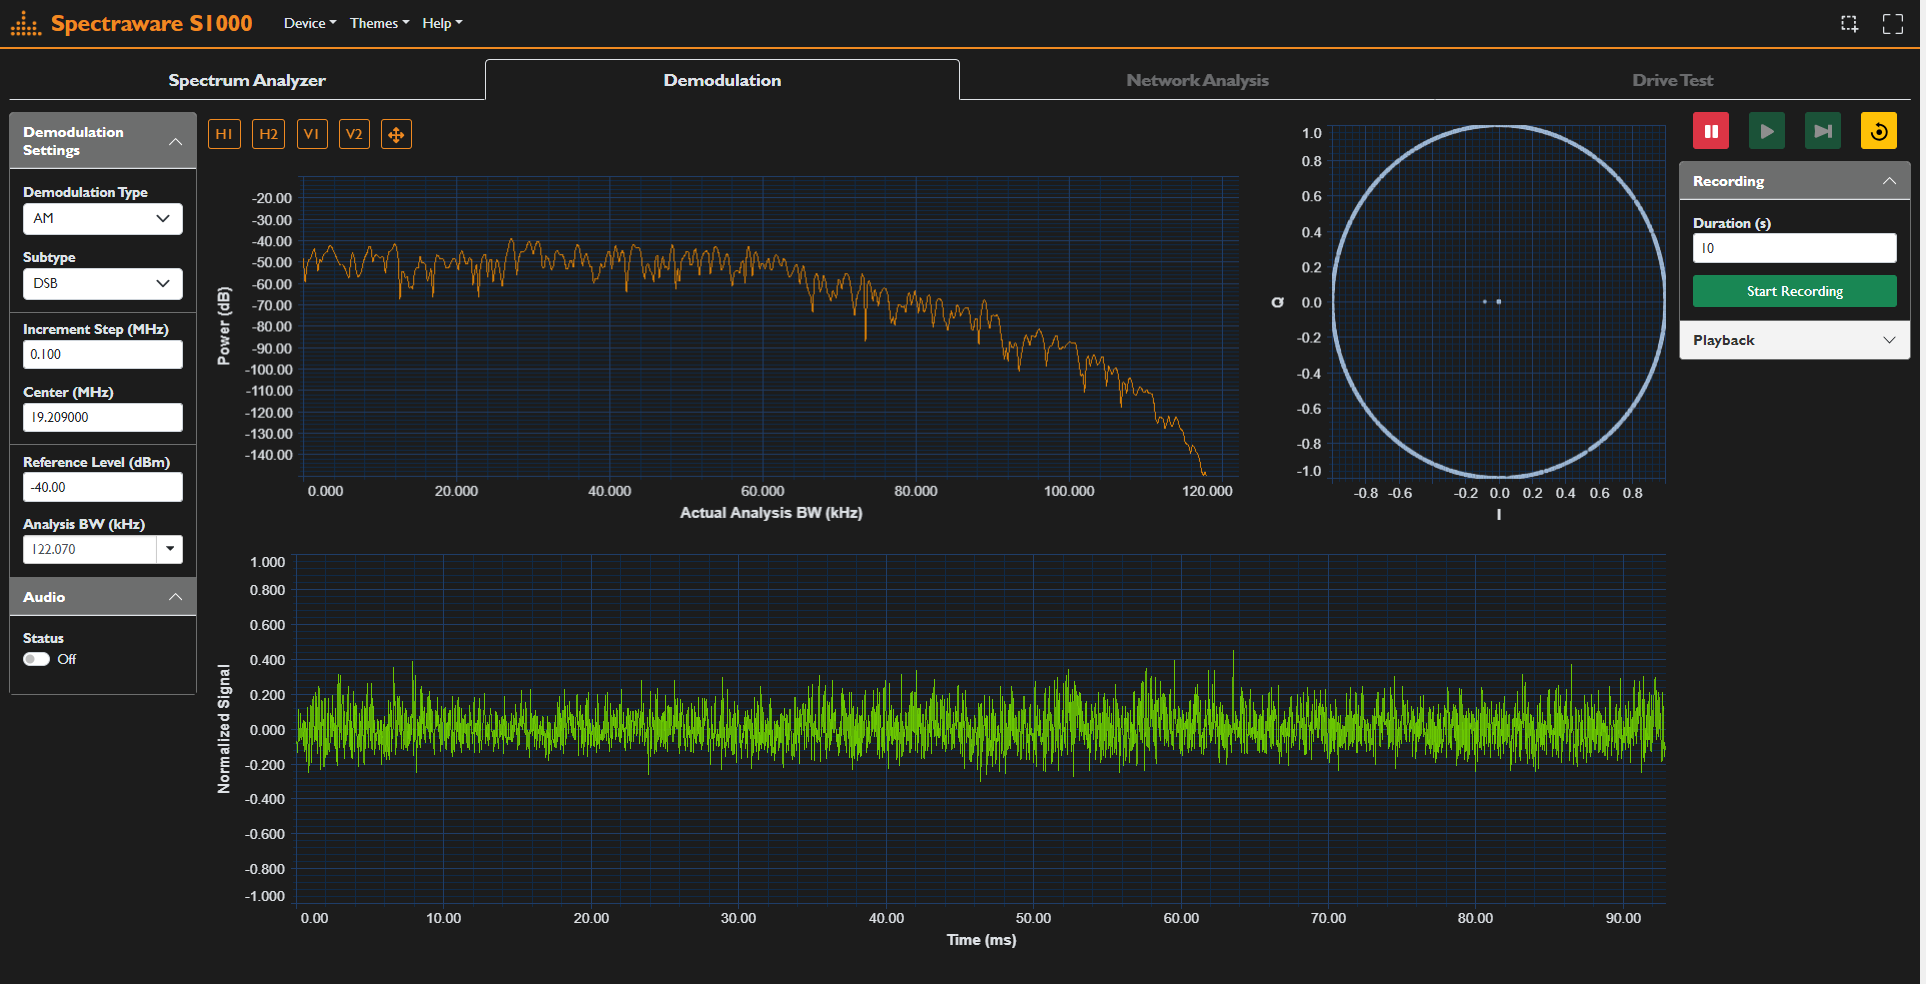
Demodulation for Signal Analysis
Conduct both spectrum and signal analysis and extract the original information-bearing signal from the carrier wave with demodulation capabilities. Gapless streaming allows seamless playback of demodulated audio which can be amplified from 0% – 300%. View Constellation, Frequency Domain, and Time Domain graphs in the clean, professional interface and record and play back streams with full demodulation and graphing support.
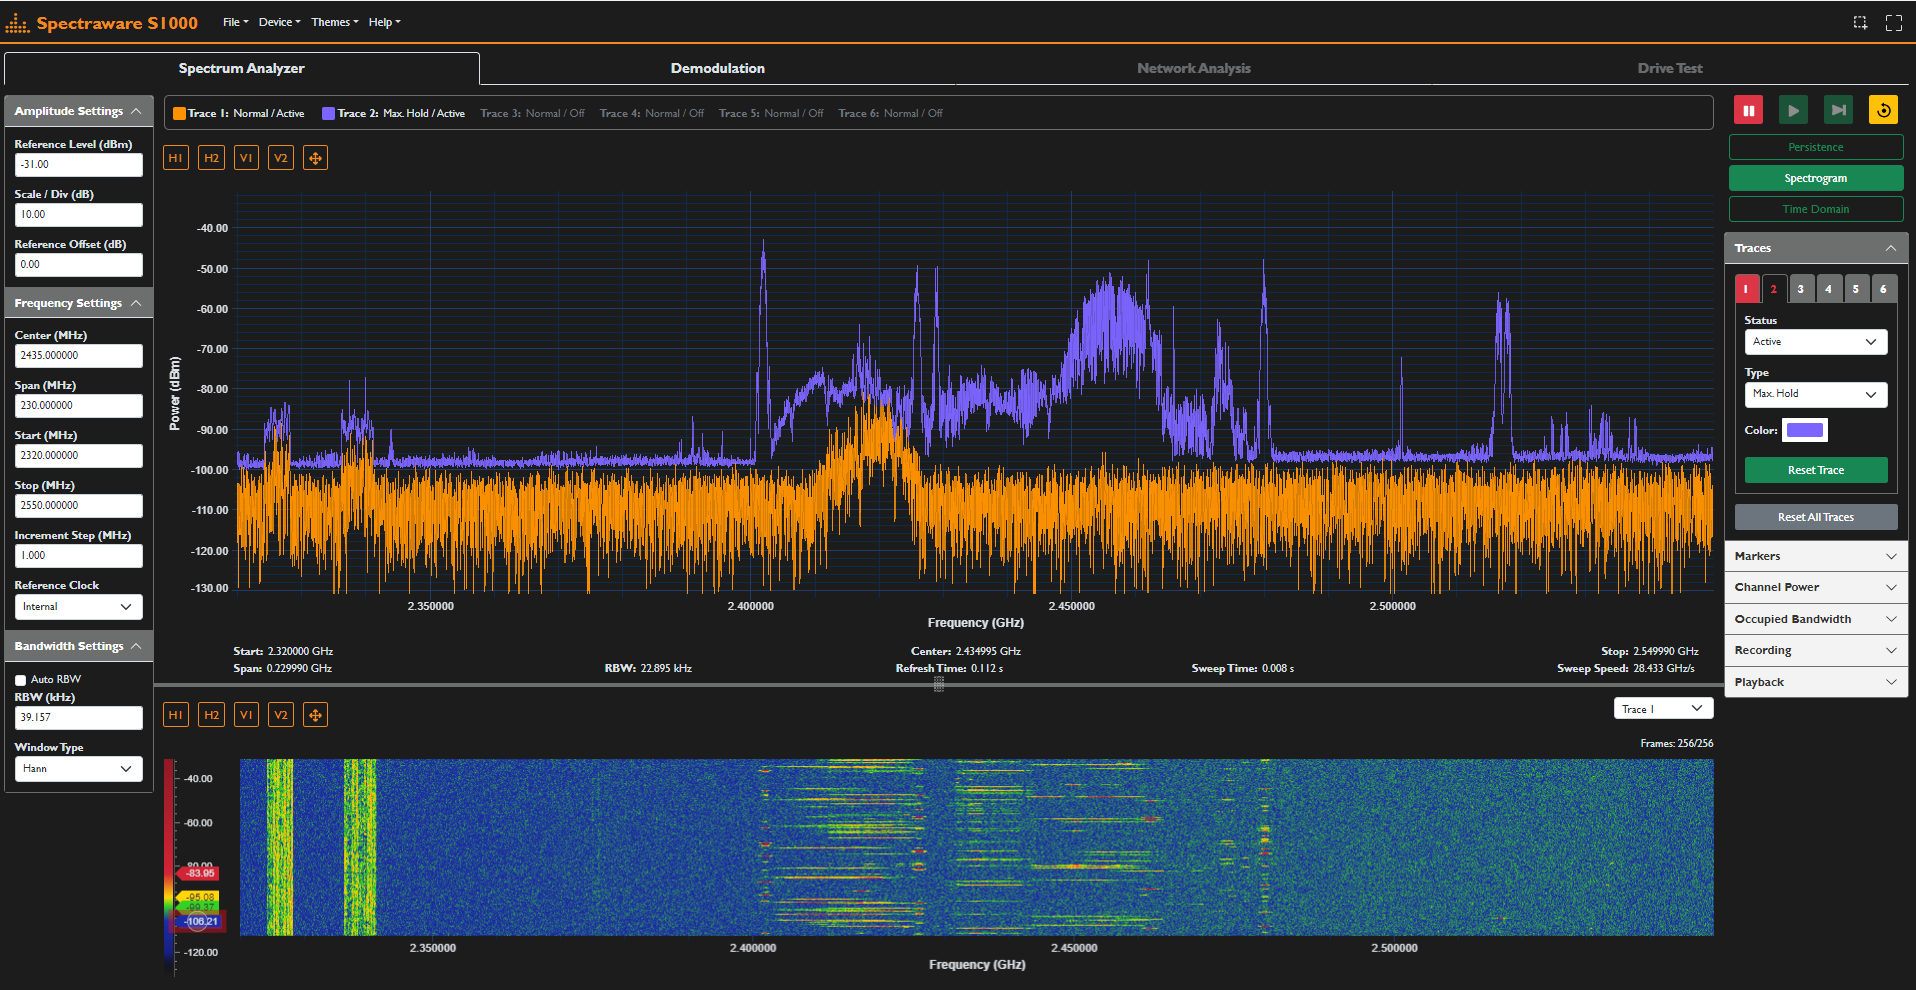
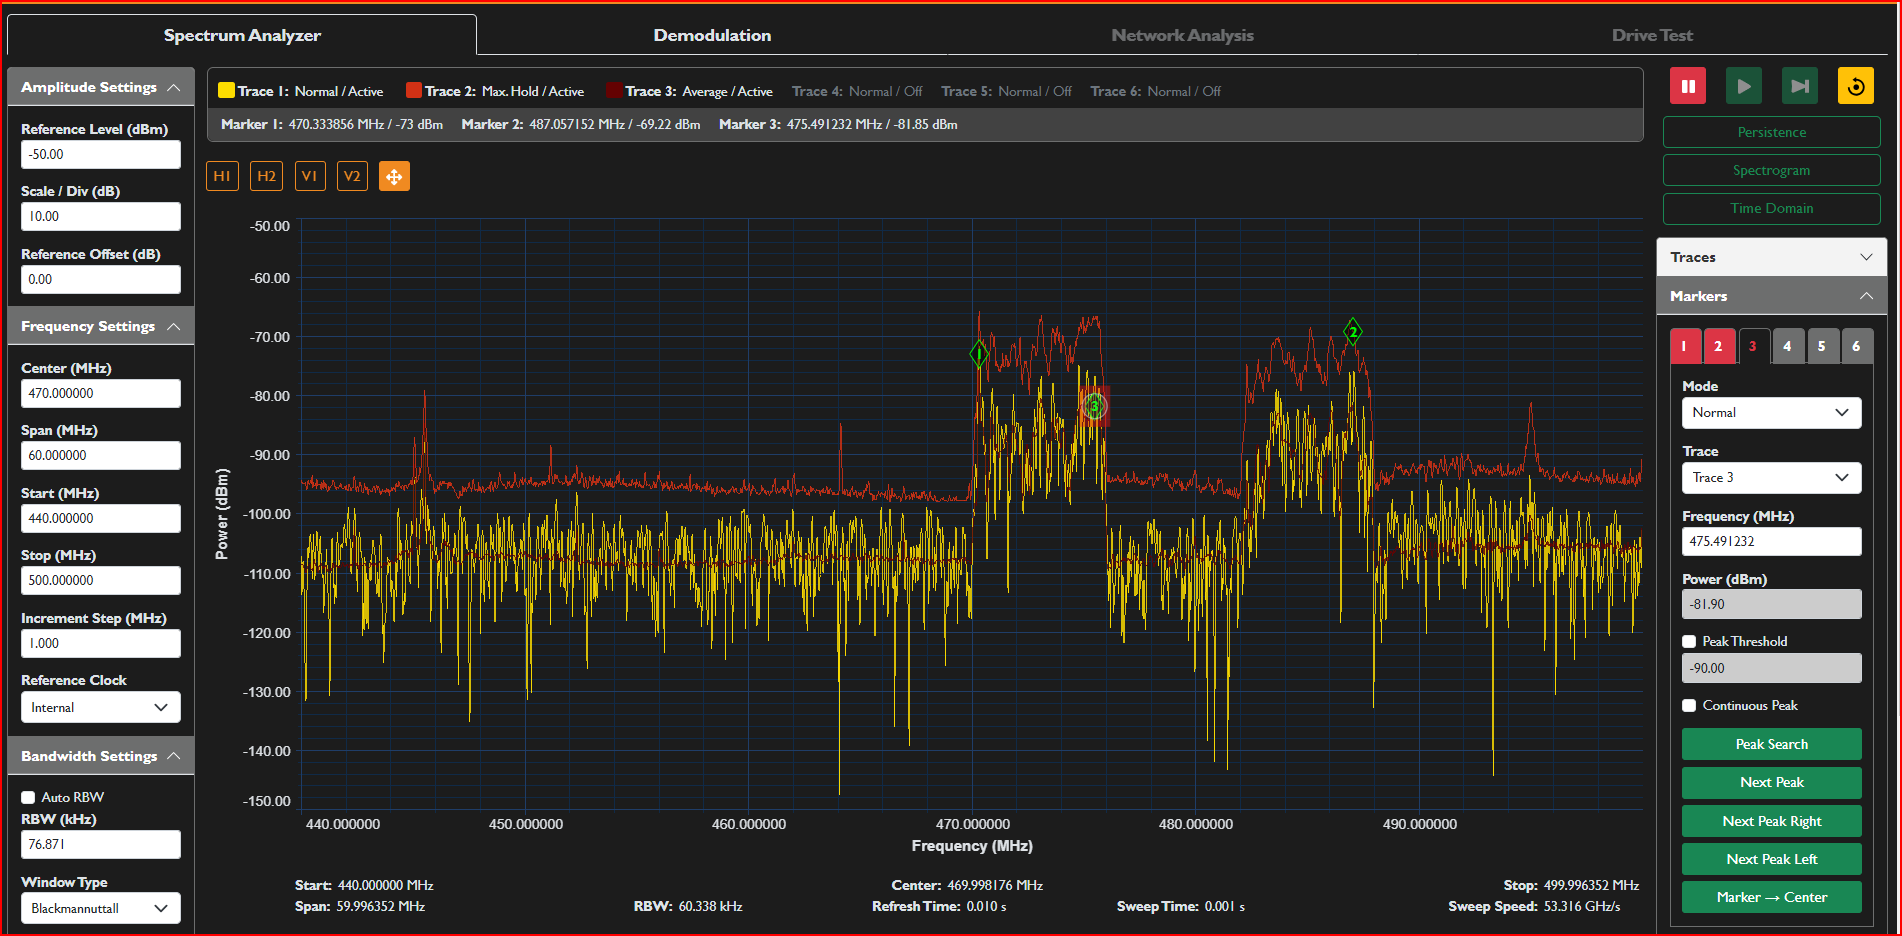
Powerful Measurement Tools
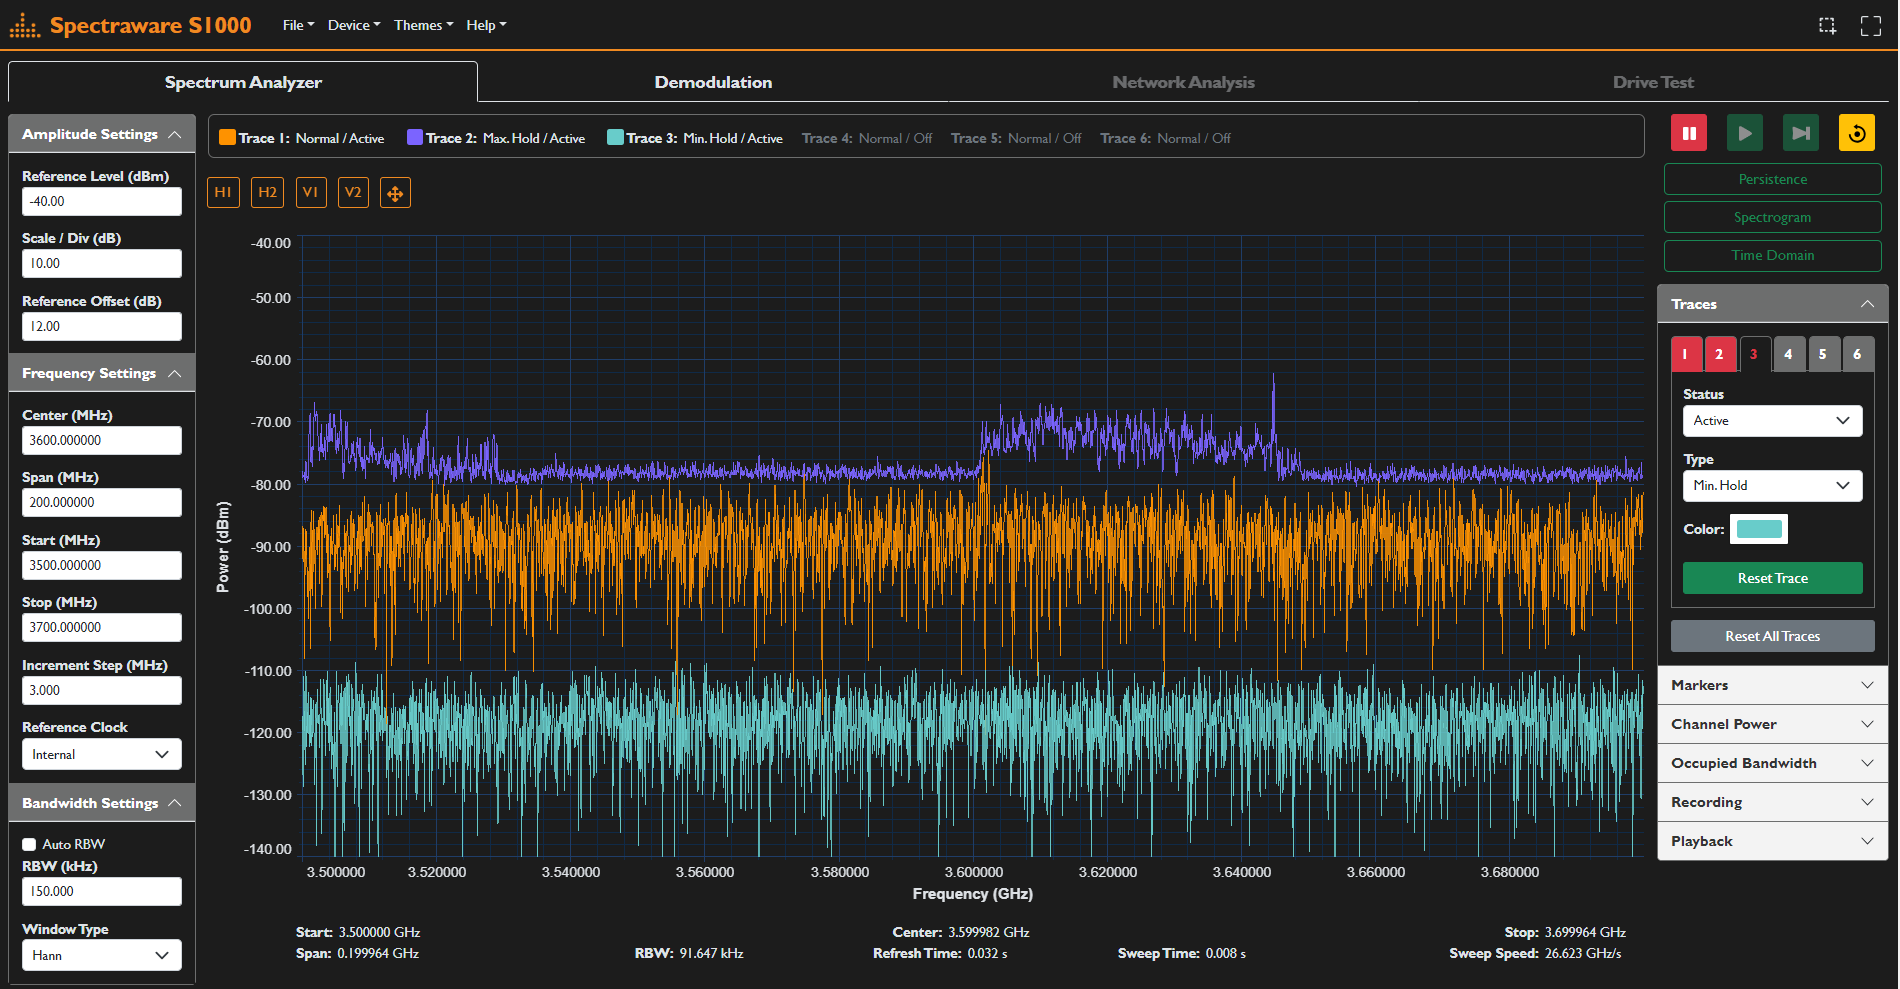
The Spectraware S1000 software provides the capabilities you need with a large collection of standard features and functions. Automatic measurements including Channel Power and Occupied Bandwidth, built-in horizontal and vertical cursors, multiple markers, and various traces are all available to analyze all signal related parameters.
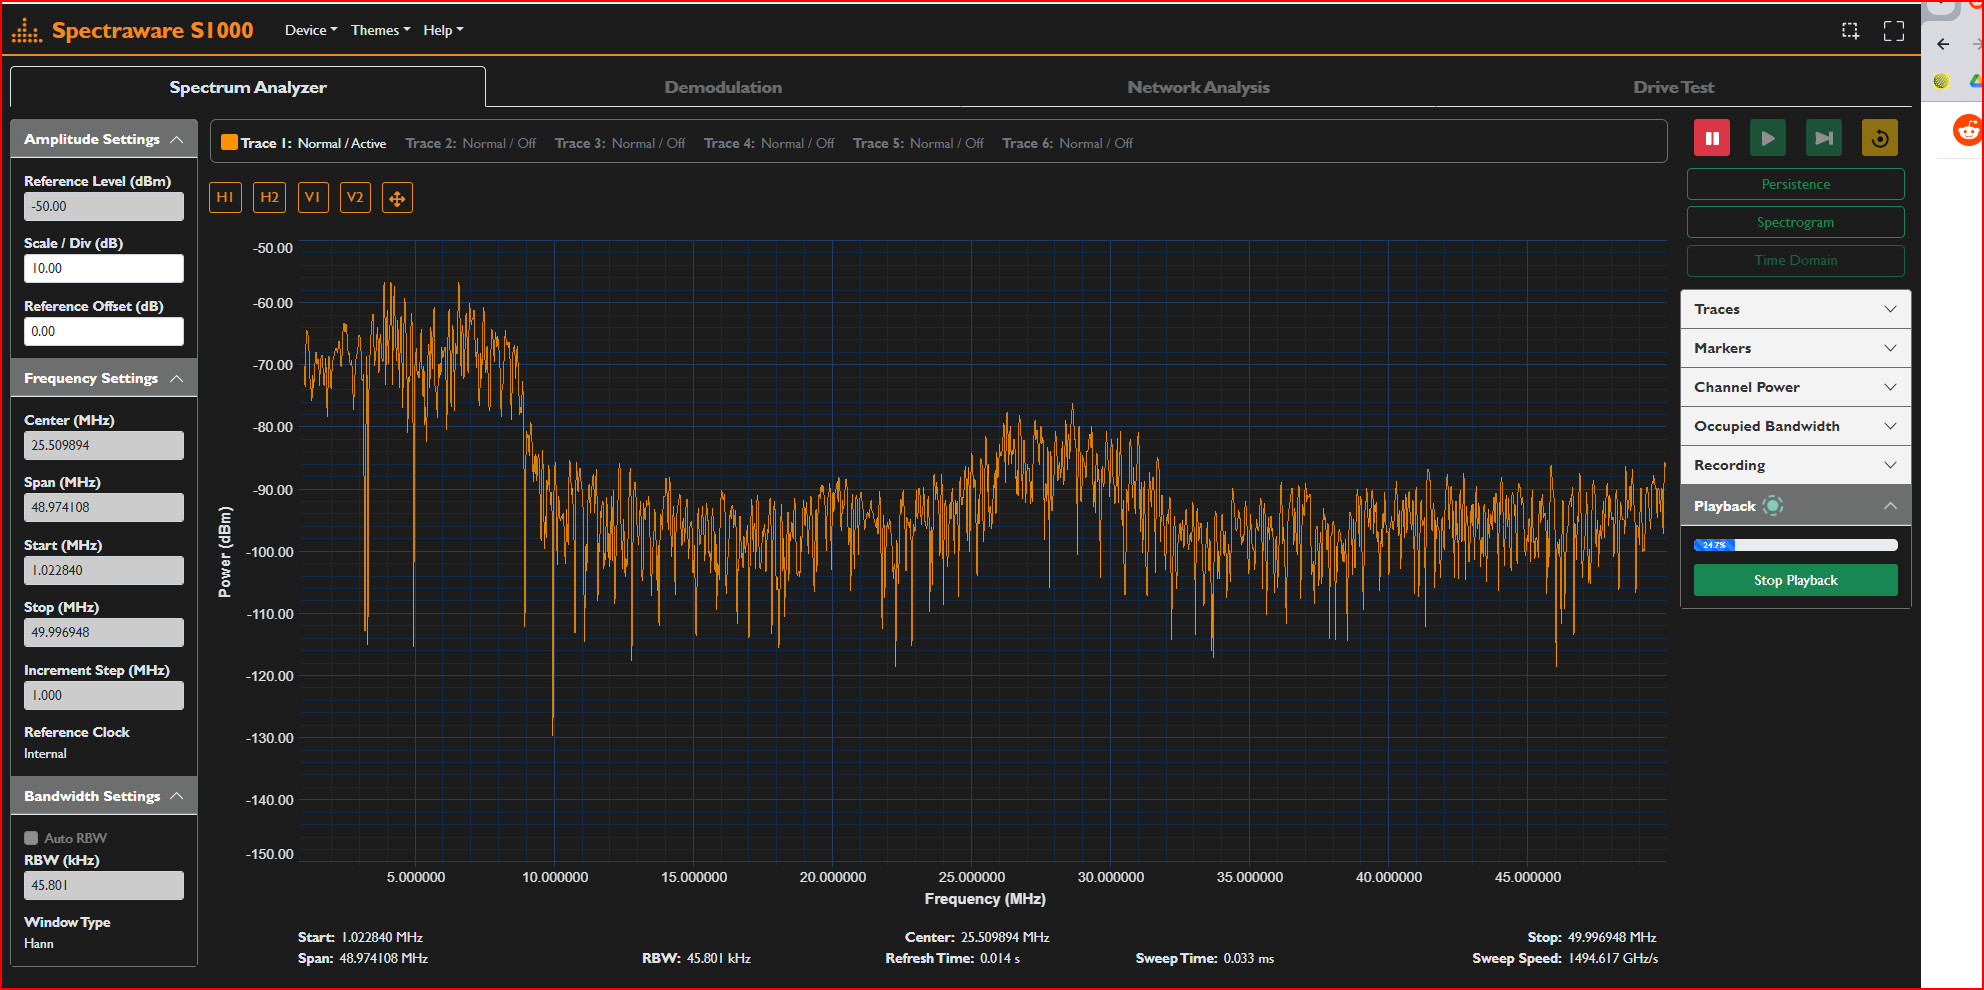
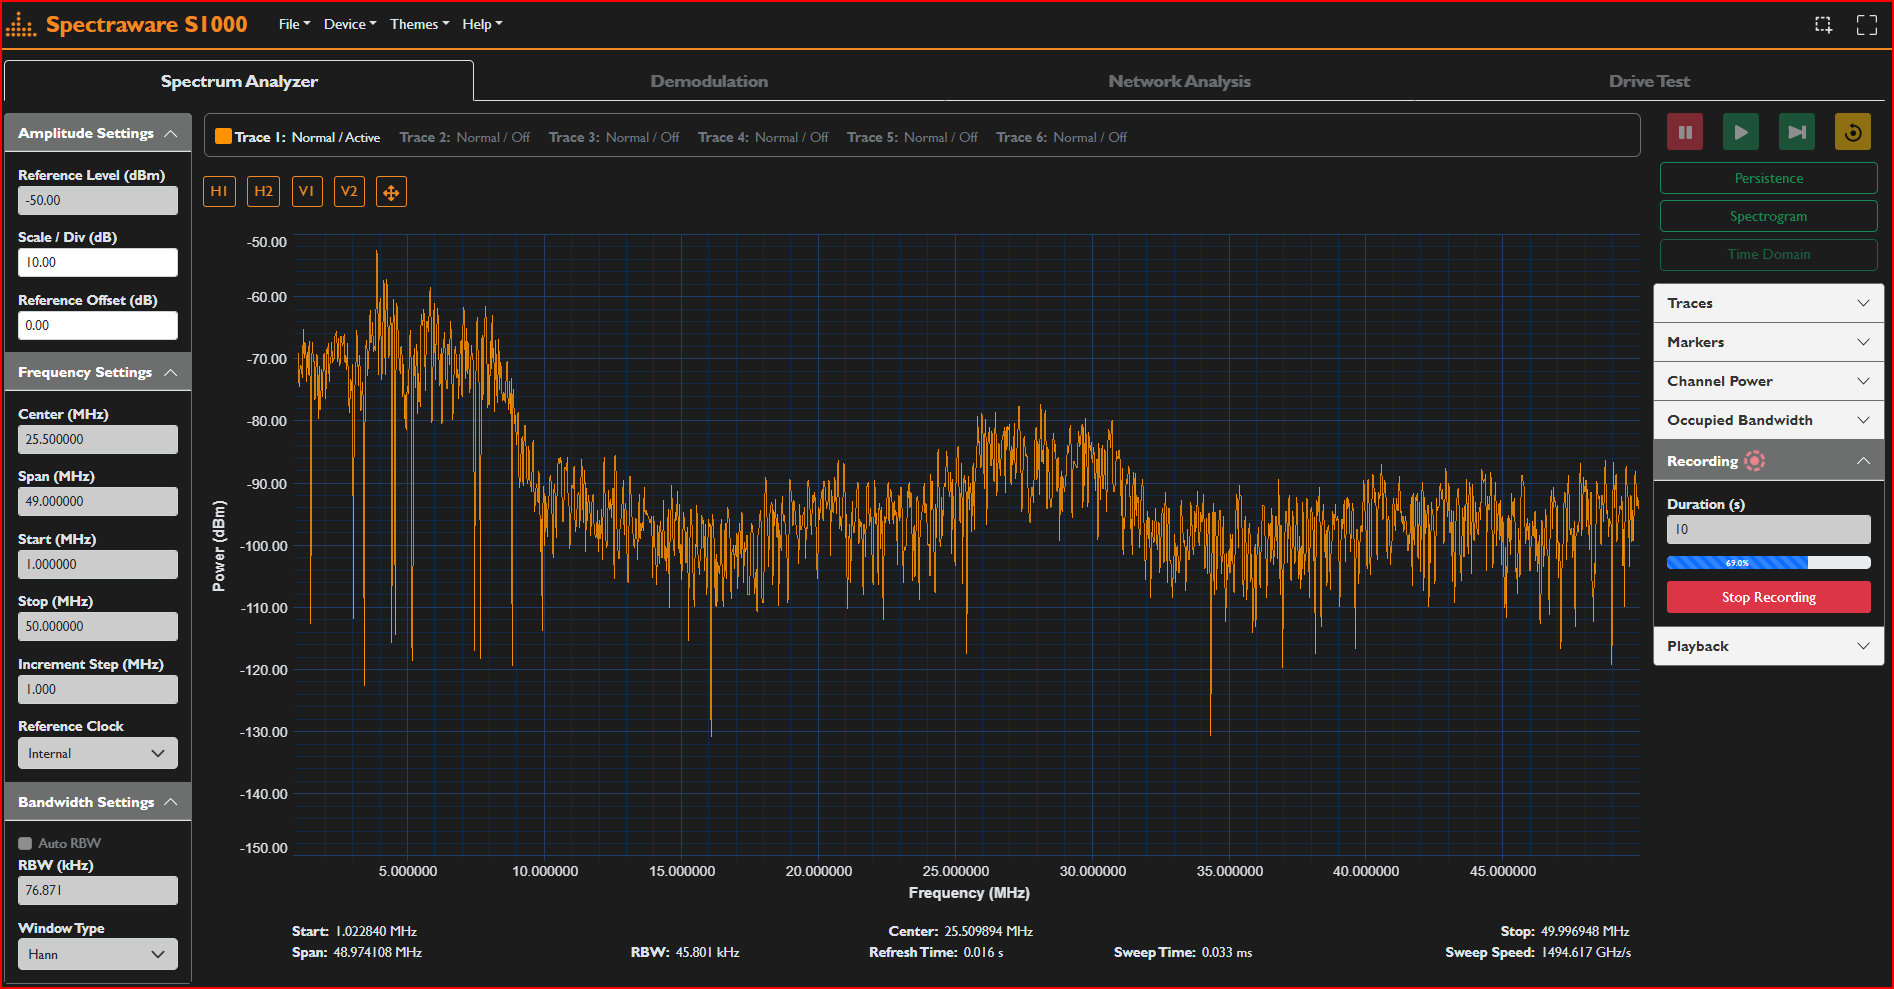
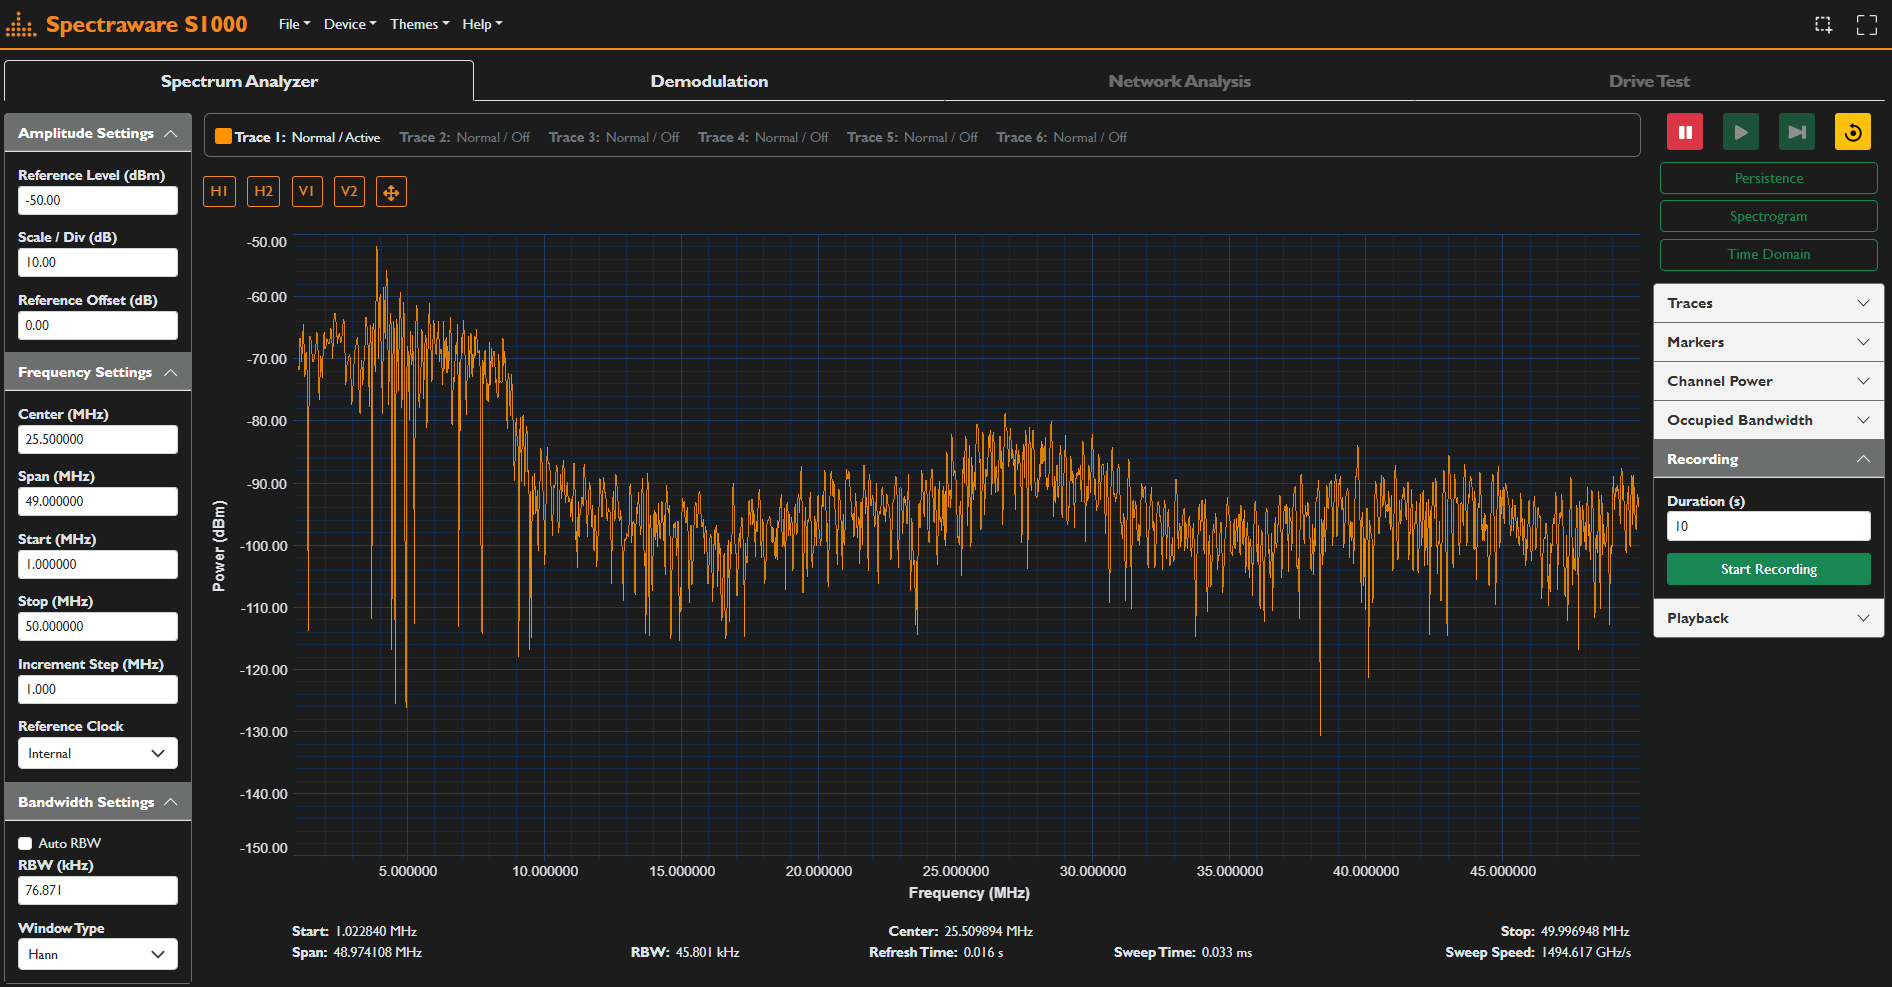
Record and Save for Future Analysis
Easily save and record data for future in-depth analysis that is difficult to do in real-time. Users can either manually save data for any duration of time or set up triggers to automatically capture and save only if the signal falls within a specified range. This makes the file size more management and allows the user to capture only the signal of interest.

Download the all NEW thinkRF Spectrum Analysis Software for FREE*
Gain access to the performance, capabilities, and functions needed to conduct
spectrum and signal analysis!
*S1000 works only with the thinkRF RTSA. *It’s Linux compatible as well.
* S1000 works only with the thinkRF RTSA